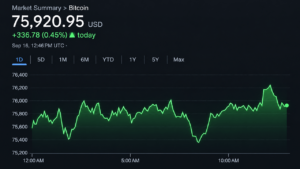
Bitcoin Drops Back to Its Local Range as Bear-Market History Repeats

Bitcoin (BTC) dipped below $62,500 at Friday’s Wall Street open as stocks took a fresh hit from the US-Iran war.
Key points:
Bitcoin gives traders a sense of deja-vu as local highs spark rejection and rangebound moves continue.The US-Iran war pushes stocks and crypto lower.A bear-market trend line is now in place as resistance, copying historical patterns.
BTC price action stays “very choppy”
Data from TradingView showed BTC/USD extending losses with up to 2% daily downside.
BTC/USD one-hour chart. Source: Cointelegraph/TradingView
US stocks opened in the red, with the Nasdaq Composite Index also down nearly 2% at the time of writing. Fresh military strikes on Iran fueled the risk-asset retreat, while tech stocks continued to see selling pressure.
Trading resource The Kobeissi Letter also flagged weakness arising from earnings disappointments, with Netflix shedding over 10% to start the US session.
“The stock is now down -50% over the last 12 months and trading at its lowest level since August 2024,” it noted in a post on X.
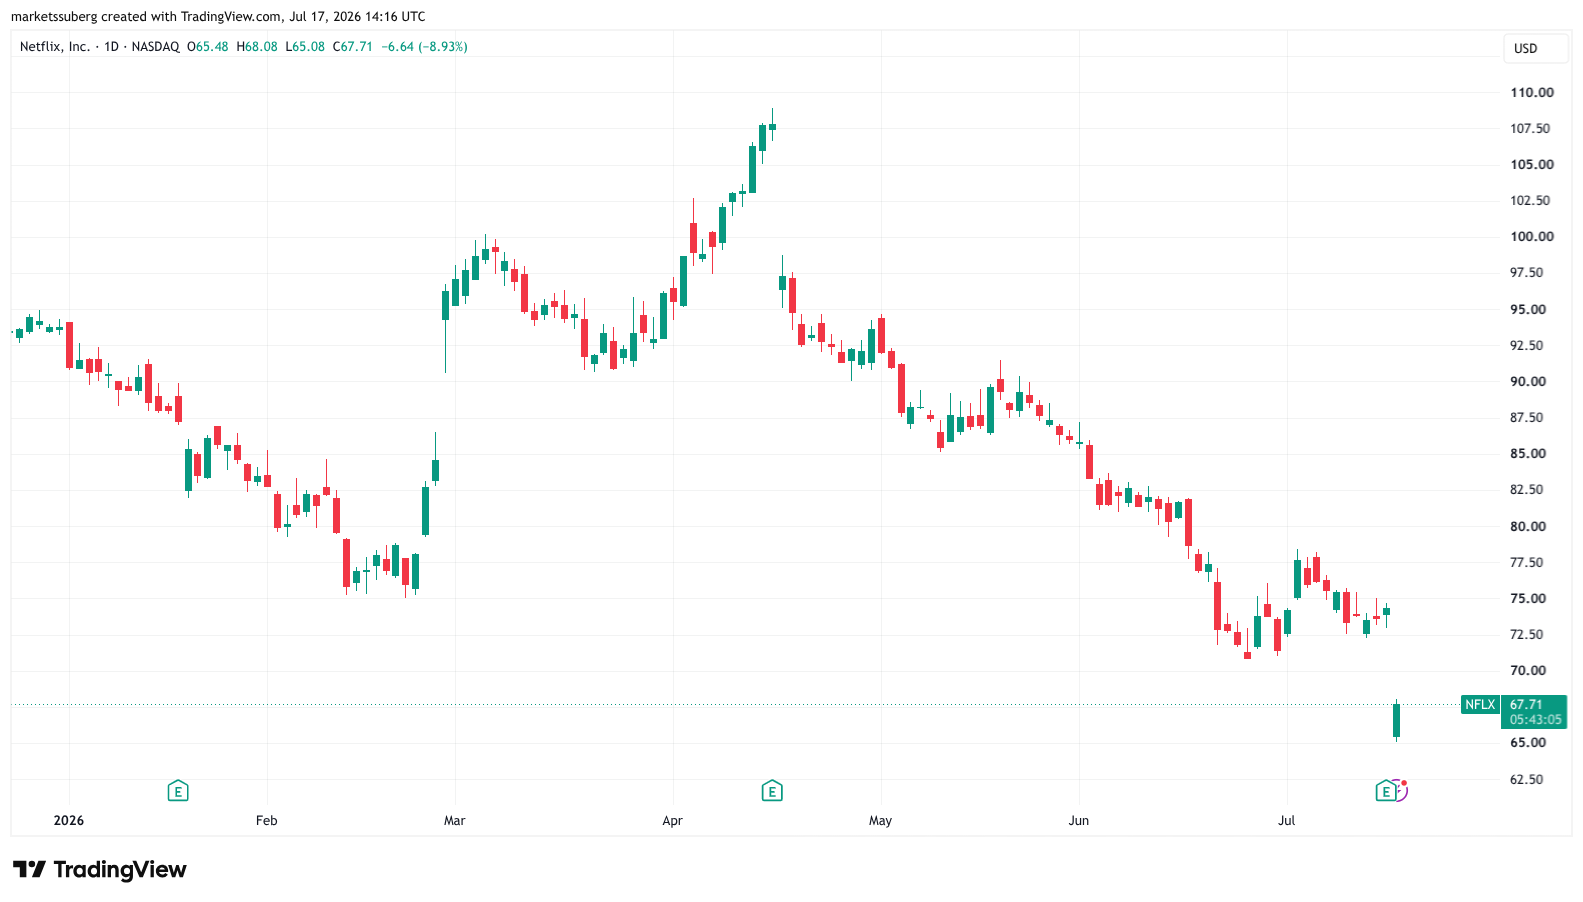
Netflix stock one-day chart. Source: Cointelegraph/TradingView
After hitting three-week highs, BTC price action fell back into its established range as traders saw copycat moves.
“Market just keeps repeating same things,” commentator Exitpump wrote on X.
“Dump into passive demand, OI increases with shorts piling up while spot starts buying which leads to bounce.”
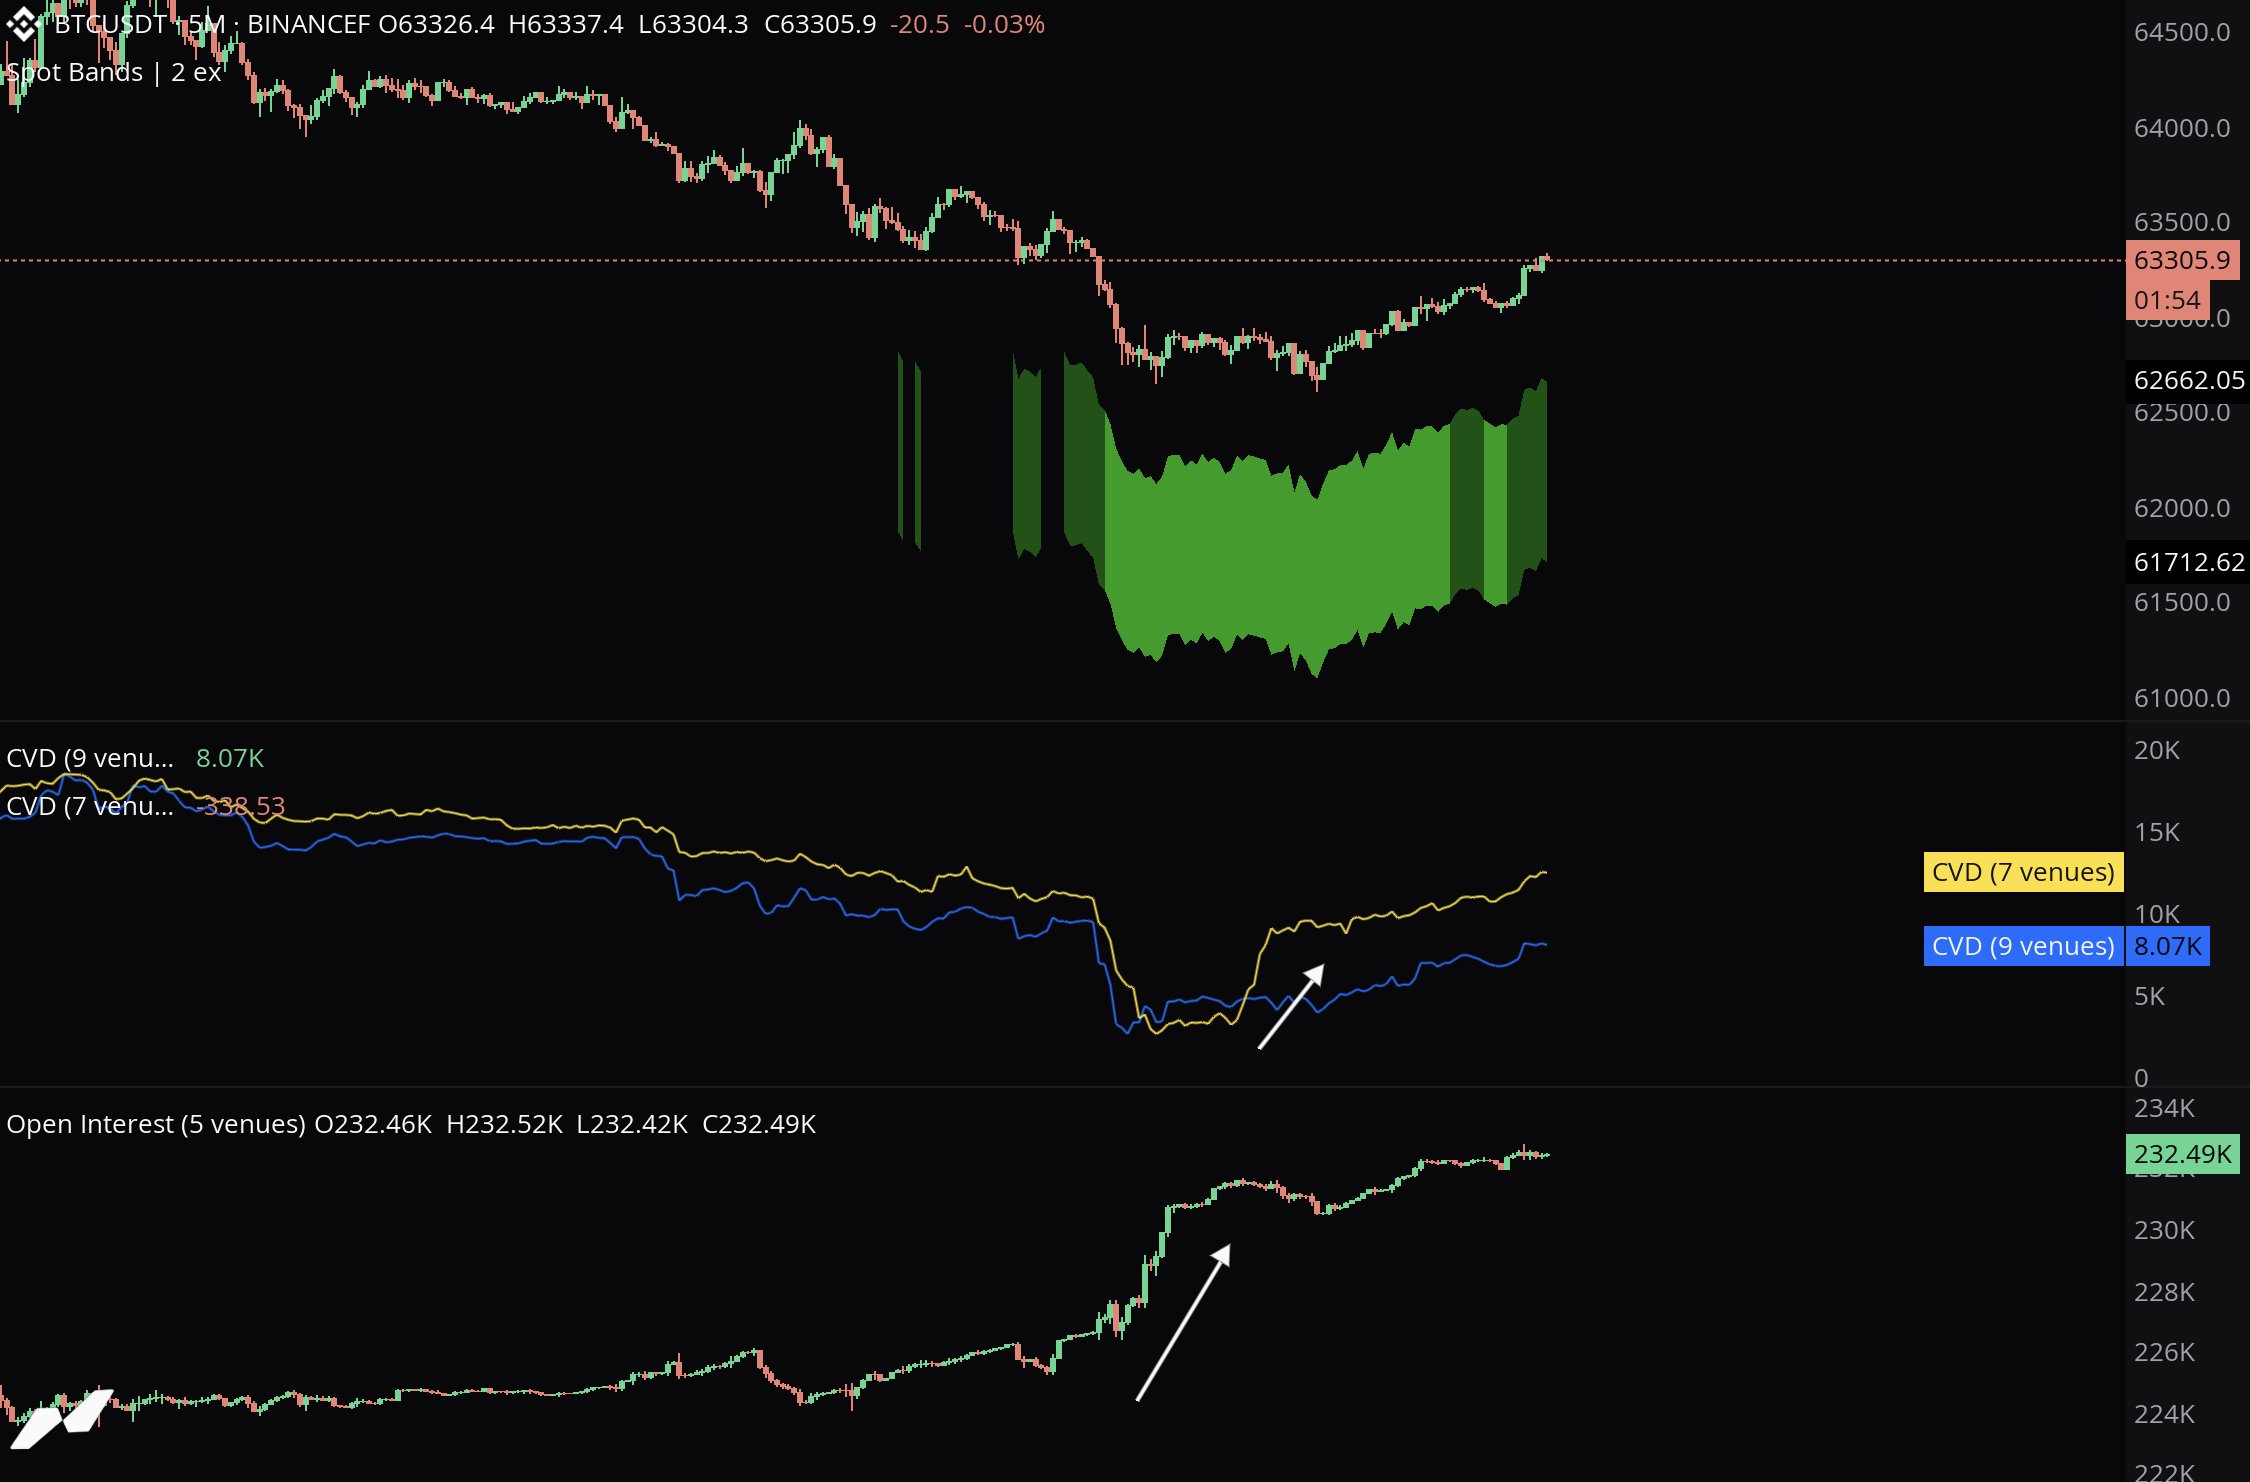
BTC/USDT five-minute chart with order-book data. Source: Exitpump/X
Trader Daan Crypto Trades argued that current behavior was “typical” of summer.
“Very choppy few days up, few days down kind of price action the last few weeks. No real action anywhere really,” he summarized.
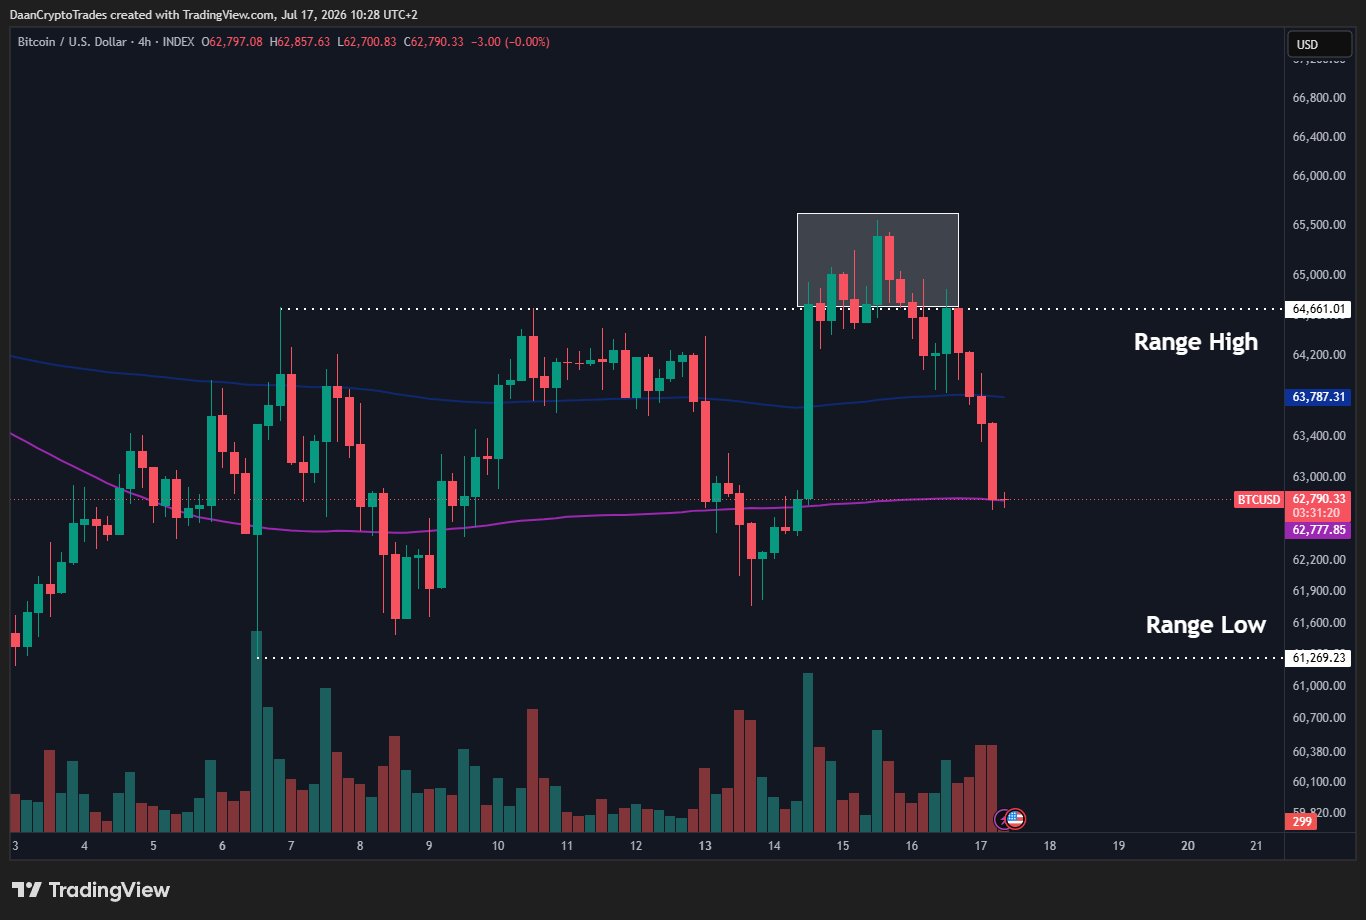
BTC/USD four-hour chart. Source: Daan Crypto Trades/X
Bitcoin seals key bear-market repeat
Trader Jelle, meanwhile, remained optimistic, seeing range lows holding.
Related: Bitcoin bottom countdown nears 50 days after BTC supply in loss passed 50%
“Still think this looks good for a relief rally in the next weeks – which would give the market room to drop into October without nuking much deeper,” he told X followers.
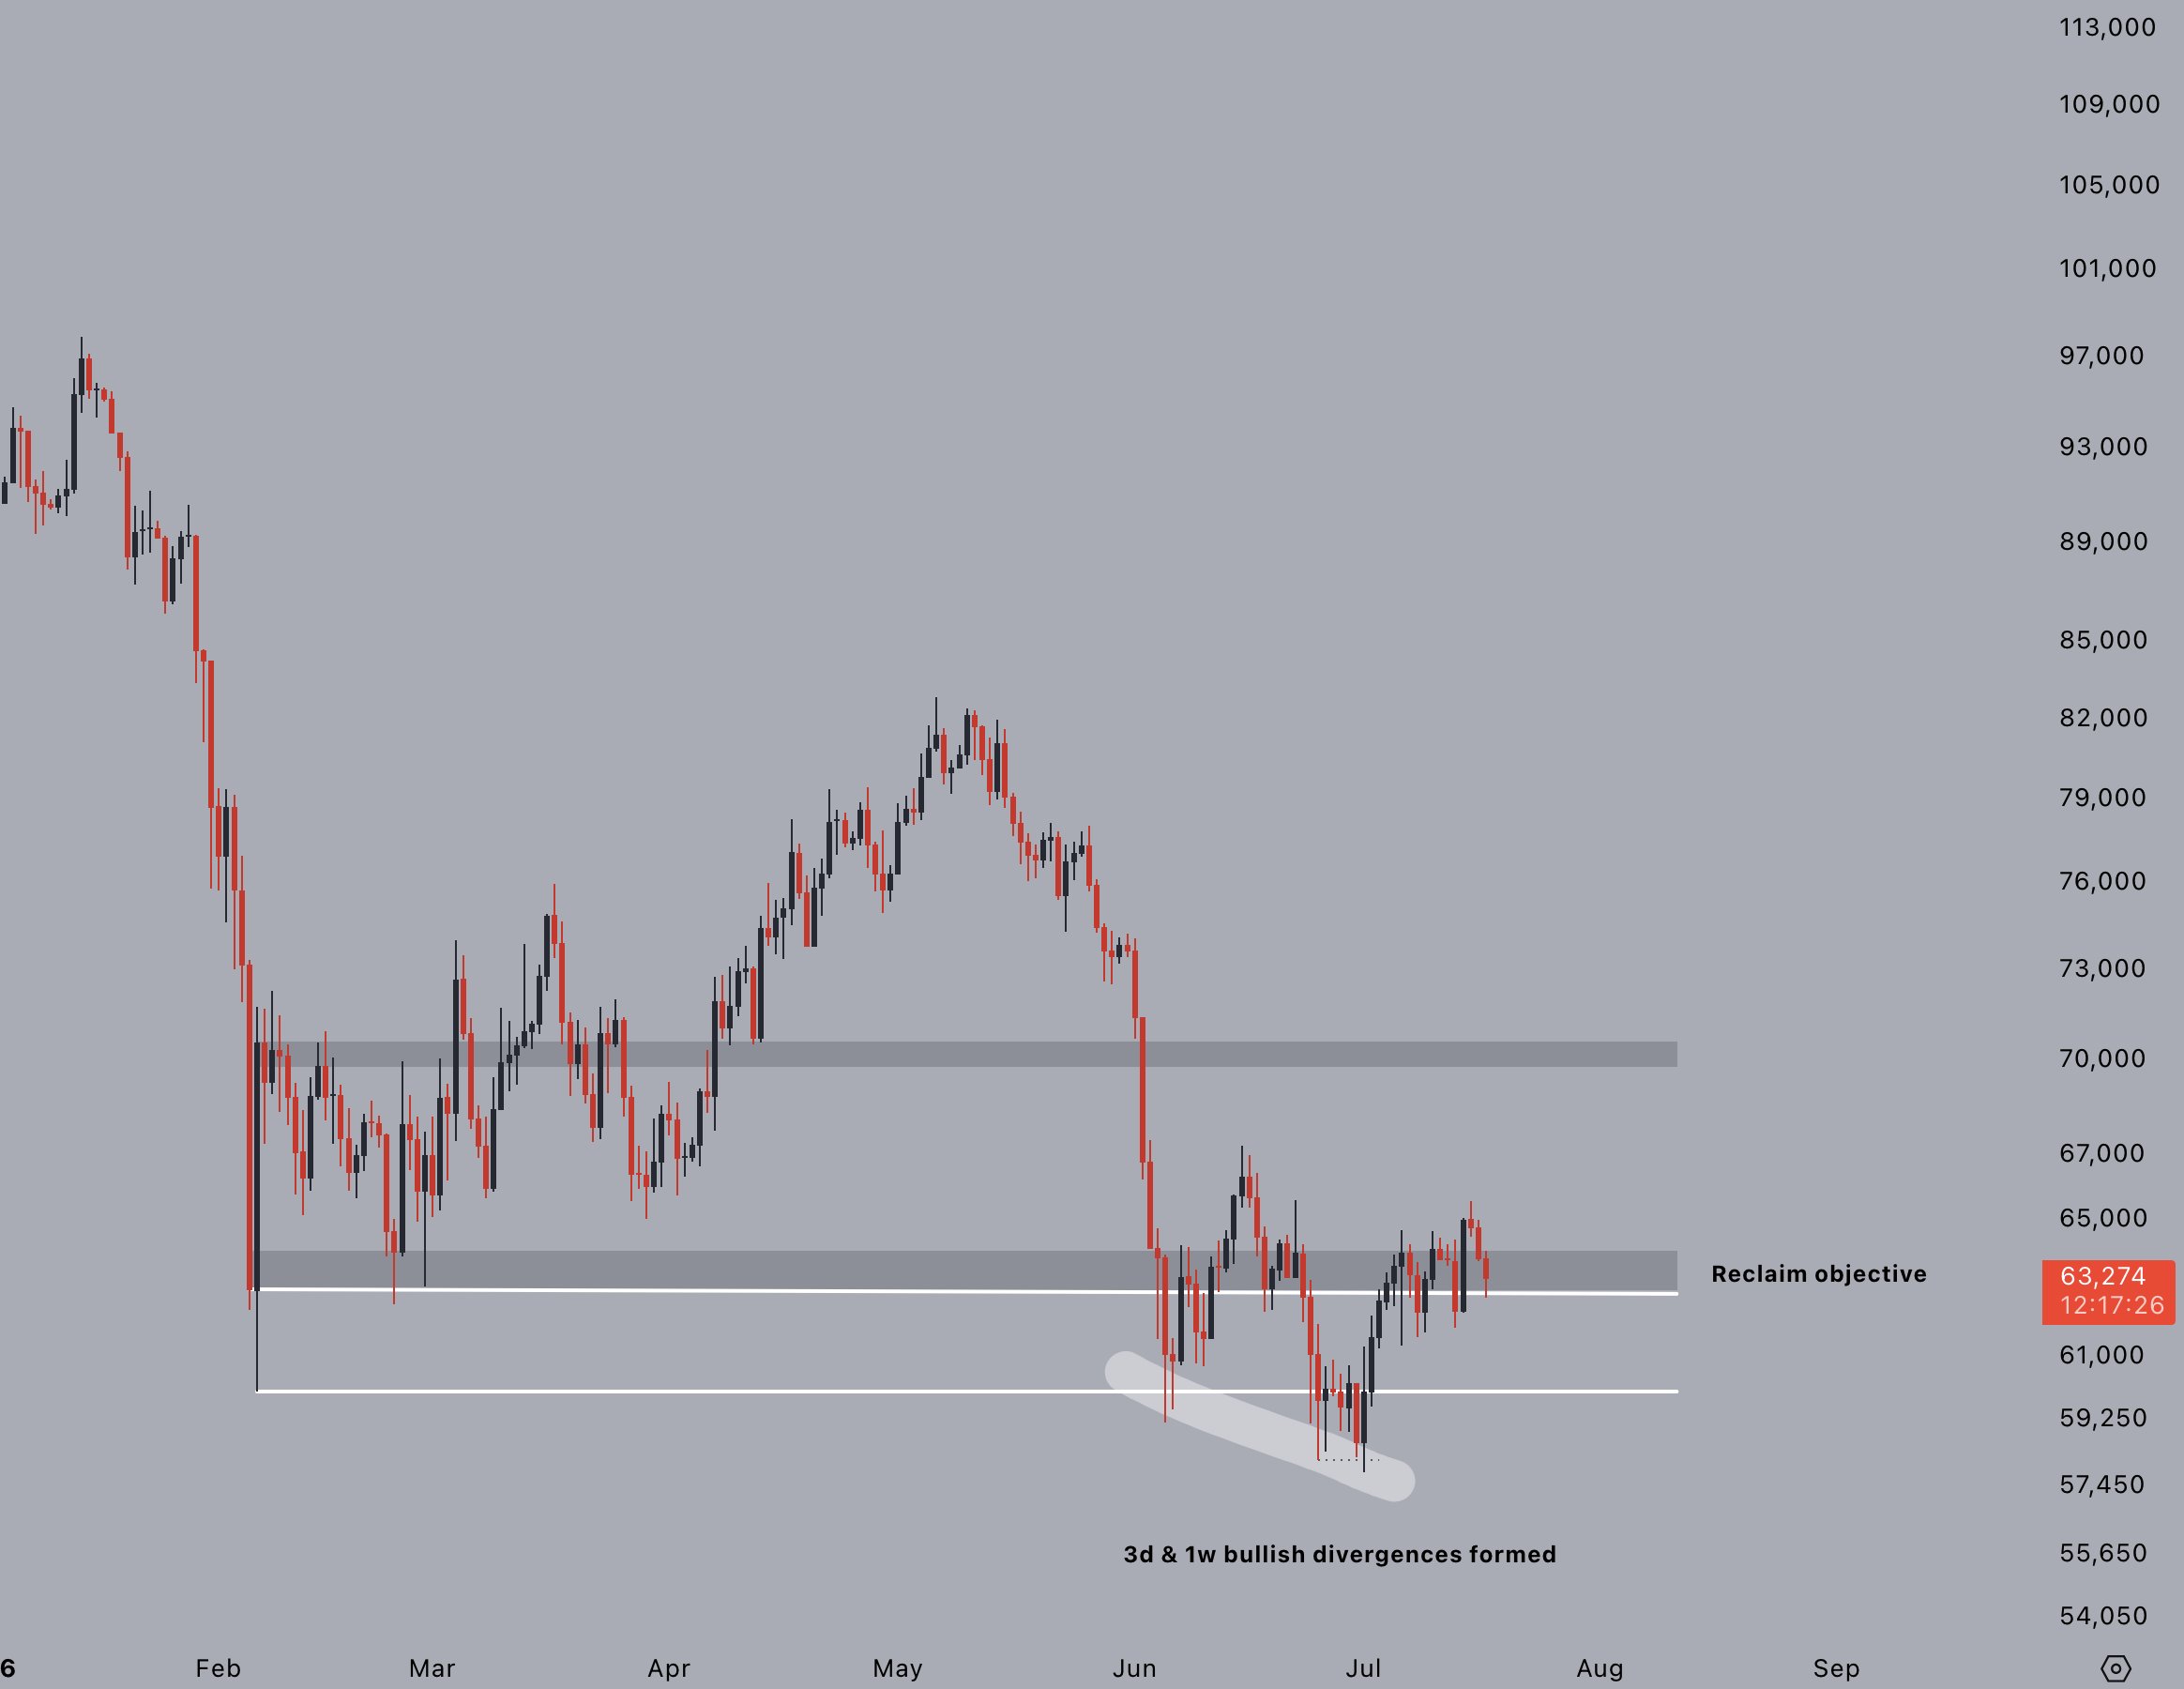
BTC/USD one-day chart. Source: Jelle/X
In updates on the bear market’s progress, trader and analyst Rekt Capital suggested that Bitcoin’s long-term downtrend was now in its final stages.
BTC/USD, he wrote, had flipped its 50-month exponential moving average (EMA) to resistance, repeating bear-market history to set up its drop to a long-term floor.
“The necessary technical milestone has been achieved,” he confirmed.
“Which technically indicates that the majority of the anticipated move has already happened.”
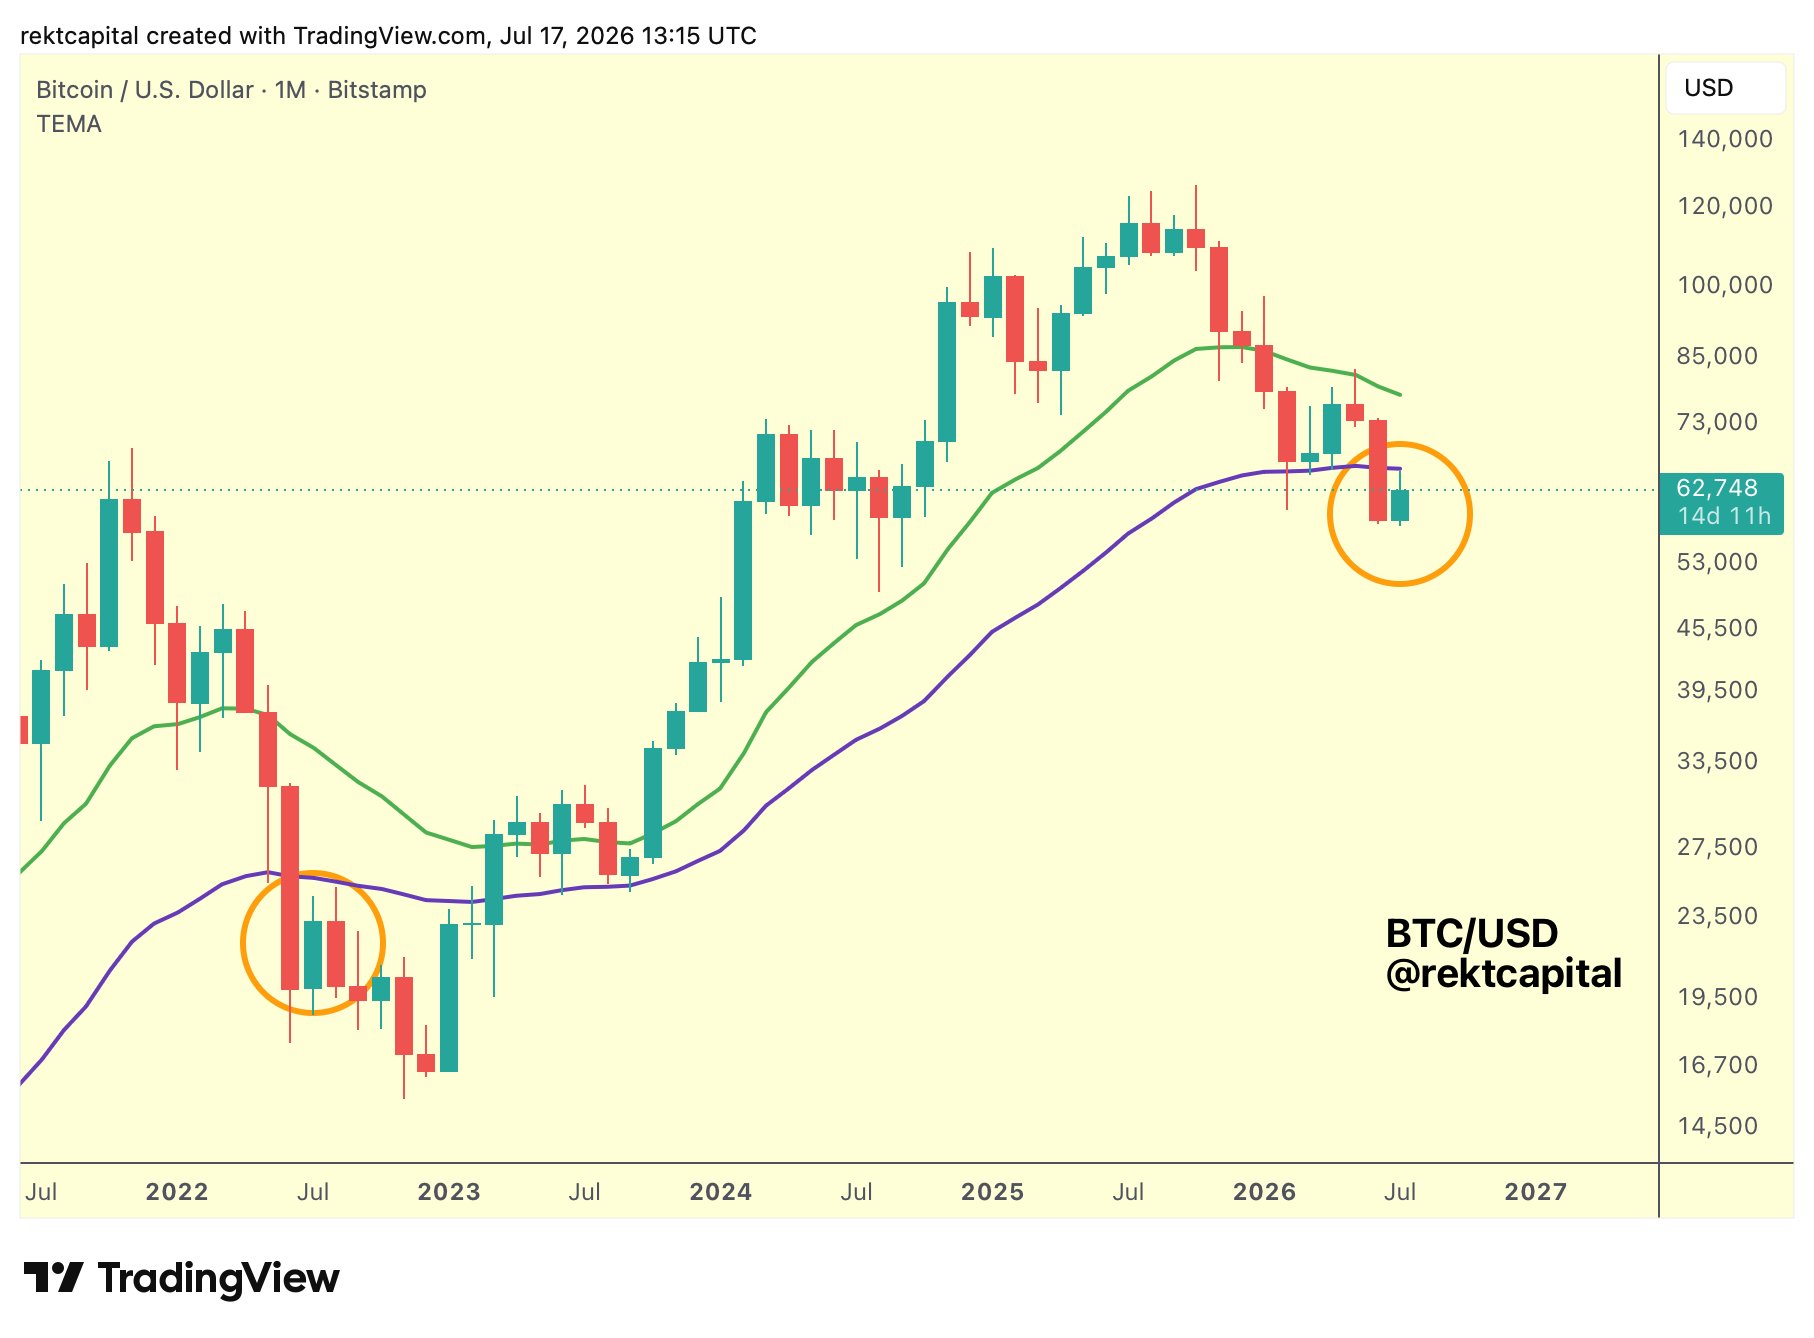
BTC/USD one-month chart with 21, 50EMA. Source: Rekt Capital/X
As Cointelegraph reported, Rekt Capital saw the July relief bounce ending with the onset of next month.