NFLX Price Prediction: Every Analyst Target Sits Above the Binance Contract Price as Sell Flow Dominates Short-Term Tape

Home
Latest reporting
Price forecast
The Netflix tokenized stock on Binance futures was changing hands at $70.47 as of October 17, 2026 — below all five analyst price targets published in the preceding four days, ranging from Rosenbla…
Market analysis includes conditional scenarios, not assured price outcomes or investment advice. Check the data, assumptions and dates cited.
A Widening Gap Between Contract Price and Published Equity Targets
The Binance futures contract tracking Netflix, Inc. (NASDAQ: NFLX) printed $70.47 at the time of data observation, a decline of 0.65% over the prior 24 hours, with the session range spanning $69.90 to $72.05. The contract price sits below every analyst price target published for the underlying Netflix equity between October 13 and October 16, 2026, according to Benzinga.
Those targets apply to NASDAQ: NFLX rather than directly to the Binance tokenized instrument, and their implied time horizons are not disclosed in the supplied evidence. They provide a reference frame for the underlying company’s perceived value, not contract-level trading signals. The most conservative figure — Barton Crockett of Rosenblatt Securities, who maintained a Neutral rating with an unchanged $75 target on October 16 — sits roughly 6.4% above the current contract price. The most optimistic, Brian Pitz of BMO Capital, who lowered his target from $135 to $125 while keeping an Outperform rating on October 16, implies a gap of approximately 77% above the current Binance contract print.
Analyst Revisions Signal Tempered Optimism, Not Abandonment
Three of the five analyst actions in the supplied record involve outright target reductions. Wedbush’s Alicia Reese cut from $105 to $90 while retaining an Outperform rating on October 16. BMO Capital’s Brian Pitz trimmed from $135 to $125 while keeping Outperform, also on October 16. KeyBanc’s Justin Patterson reduced from $92 to $85 but maintained an Overweight on October 13. The remaining two actions differ in character: Jefferies’ John Colantuoni assumed coverage on October 15 with a Buy rating and an $85 target — a fresh initiation with no prior target on record — while Rosenblatt’s Barton Crockett left his $75 Neutral target explicitly unchanged. The thread running through all five actions is that bullish or neutral ratings were maintained even as price expectations were recalibrated downward. No analyst in the supplied evidence moved to a sell-equivalent rating.
Rosenblatt’s $75 Neutral target, the lowest in the range, frames the floor of the analyst cluster derived from the supplied data and sits closest to the current contract price.
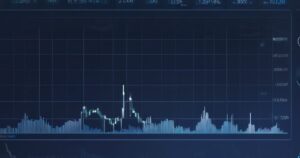
Hourly candlesticks (about 96 bars), same endpoint as our cryptocurrency price pages. Numbers below refresh from 1-minute klines.
More NFLX news, NFLX price prediction and analysis
Technical Structure: Compression Below a Cluster of Resistance
The moving average picture is split between timeframes. The contract is trading just below both the 7-period SMA ($70.73) and the 12-period EMA ($70.50), while holding above the 20-period SMA ($69.75). The 50-period SMA at $73.80 remains well above the current price, and the EMA 12 ($70.50) has slipped below the EMA 26 ($71.09) — a configuration that reads as short-term momentum lagging the longer-term trend.
The MACD line and signal line have converged at –0.5918, producing a histogram of essentially zero. The prior bearish momentum is no longer accelerating, but whether that indicates stabilization or a brief pause depends on subsequent price action rather than the indicator alone. The 14-period RSI at 46.59 sits in neutral territory, providing no extreme-reading counter-signal in either direction. The Stochastic oscillator shows %K at 58.65 crossing above %D at 46.92 — a mild short-term divergence within the indicator — though the broader context remains cautious given the sub-pivot price position.
Bollinger Band placement adds texture: the %B reading of 0.6319 places the contract in the upper half of the band channel (upper $72.47, lower $67.03, middle $69.75), indicating the price is not at a compression extreme. The 14-period ATR of $1.44 reflects a contained daily volatility envelope and is useful for gauging stop distances against the key levels below.
The supplied key levels create a well-defined near-term map. The pivot point sits at $70.81 — fractionally above the current price of $70.47, placing the contract in a sub-pivot position at observation time. Immediate resistance stands at $71.71, with strong resistance at $72.96. Immediate support is at $69.56, with stronger structural support at $68.66.
Derivatives Positioning: Long-Skewed Accounts, Sell-Side Taker Flow
Binance futures data as of the 09:00 UTC observation on October 17, 2026 shows a divergence between account positioning and active order flow. Binance global accounts were positioned 70.1% long versus 29.9% short (ratio 2.3456), while the top-trader cohort showed 78.0% long against 22.0% short (ratio 3.5455). These figures describe the composition of open positions within Binance account cohorts — they do not represent broader equity market positioning, institutional shareholder data, or any instrument other than the Binance futures contract.
The taker buy/sell ratio for the same one-hour window tells a different story in real-time order flow: at 0.7102, sell-side aggression dominated, with 628 sell contracts filled against 446 on the buy side. Taker selling — where market participants hit existing bids with market orders — indicates short-term urgency on the sell side even as existing open positions remain long-skewed. Open interest stood at 67,139 contracts ($4,694,365 notional) at observation time, up 1.18% over 24 hours. Rising open interest alongside a modest price decline can indicate the accumulation of new short positions, though that remains directional inference rather than a reported fact. The 8-hour funding rate of 0.0000% is neutral, meaning neither side is paying a meaningful premium to hold exposure — consistent with a market without a decisive near-term lean.
Conditional Scenarios Framed Against Supplied Levels
Given the price sitting just below the $70.81 pivot and the sell-skewed taker flow reading, two conditional setups emerge from the supplied level structure. Both are hypothetical illustrations, not investment recommendations.
Bearish scenario — if the contract fails to reclaim the $70.81 pivot and sell pressure continues: Direction: short; Entry: $70.47; Stop: $71.71; Target: $68.66; Reward/risk: 1.46:1 (before fees, slippage and gaps).
Bullish scenario — if the contract reclaims and holds above the $70.81 pivot: Direction: long; Entry: $70.47; Stop: $69.56; Target: $71.71; Reward/risk: 1.36:1 (before fees, slippage and gaps).
The ATR of $1.44 means each stop sits within roughly one average daily range of the entry. Gaps or liquidity conditions can cause execution at prices worse than the stated stop level. Neither scenario carries an attached probability, as none is supplied in the evidence.
What to Watch
The key near-term technical test is whether the $70.81 pivot is reclaimed or continues to hold as resistance. A sustained move above $71.71 would challenge immediate resistance and shift the short-term structure; a break below $69.56 opens the path toward the $68.66 strong support. The analyst target range for the underlying Netflix equity — $75 to $125 per Benzinga-attributed data — sits well above the current Binance contract price, but no catalyst date or earnings schedule is present in the supplied evidence, so the timing of any potential convergence cannot be anchored.