NFLX Price Prediction: Analyst Targets Cluster at $85–$90 as Binance Contract Drifts Below Its Short-Term Averages

Home
Latest reporting
Price forecast
The Netflix tokenized stock contract on Binance futures was quoted at $70.29 on October 20, 2026, trading below its 7-day SMA, EMA 12, and EMA 26 while taker sell volume outpaced buyers roughly 1.6…
Market analysis includes conditional scenarios, not assured price outcomes or investment advice. Check the data, assumptions and dates cited.
Contract Price and the Distance to Analyst Targets
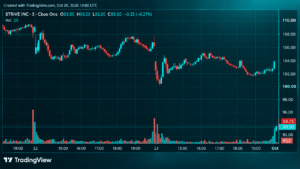
The Netflix tokenized stock on Binance futures was observed at $70.29 on October 20, 2026, a decline of 0.26% over the prior 24 hours. The session range ran from $69.14 to $70.68, spanning $1.54 — fractionally above the 14-period Average True Range of $1.47, placing intraday activity marginally above the recent norm rather than within it.
Three analyst actions on the underlying Netflix, Inc. common stock (NASDAQ: NFLX) were reported in the week of October 13–16, 2026. These targets apply to the US-listed equity and are not calibrated to the Binance futures instrument. Wedbush, via MT Newswires, lowered its target from $105 to $90 on October 16 while holding an Outperform rating. The day prior, John Colantuoni of Jefferies assumed coverage with a Buy rating and an $85 target, per StreetInsider. On October 13, KeyBanc trimmed its target from $92 to $85 while retaining an Overweight rating, sourced from a dated analyst-action table on Yahoo Finance via Walnut Invest. All three desks hold constructive ratings, yet all three have recently reduced their published targets. No earnings date or corporate catalyst is attributable from the supplied evidence, so the timing of any convergence between the contract price and these targets remains unknown.
Moving Averages: Overhead Structure
The contract’s position relative to its moving averages shapes the directional picture. The EMA 12 ($70.48), EMA 26 ($70.97), and 7-day SMA ($70.73) all sit above the current price of $70.29, forming a layered overhead cluster within a roughly $0.70 range. The SMA 20 at $69.83 remains the sole moving average below the contract, providing a nearby reference floor. Further overhead, the 50-day SMA at $73.15 marks the most significant medium-term obstacle — the contract trades nearly $2.86 beneath it. With the short-term averages stacked above and only the SMA 20 providing support from below, the moving-average structure favors sellers on a continuation basis unless those nearer averages are reclaimed.
Momentum Indicators
The RSI-14 at 46.56 sits in neutral territory, offering no clear directional edge in isolation. The MACD configuration is more instructive: both the MACD line and its signal line stand at -0.4853, producing a histogram reading of exactly zero. That convergence signals the short-term momentum differential has fully closed, but the negative absolute level confirms the indicator remains in bearish territory. A zero histogram does not indicate a reversal; it indicates a flattening, and whether that resolves via a bullish cross or a renewed bearish divergence is what the setup leaves open.
The Stochastic oscillator reinforces the cautious read: %K at 38.06 and %D at 30.45 are both below the 50 midpoint, with %D approaching the oversold threshold of 20 without yet breaching it. The Bollinger %B of 0.5834 places the contract above the band’s midpoint, though in context that reflects band width shaped by the $1.47 ATR rather than upward price pressure — the upper band stands at $72.61, more than $2.30 above the current print.
Hourly candlesticks (about 96 bars), same endpoint as our cryptocurrency price pages. Numbers below refresh from 1-minute klines.
More NFLX news, NFLX price prediction and analysis
Key Levels Framing the Near-Term Range
The pivot point sits at $70.04, with immediate support at $69.39 and strong support at $68.50. To the upside, immediate resistance is $70.93 and strong resistance is $71.58. At $70.29, the contract is above the pivot but below both resistance levels, compressed into roughly $0.64 between the current price and the first meaningful overhead hurdle.
Derivatives Positioning on Binance Futures
The 8-hour funding rate was observed at exactly 0.0000% on October 20, 2026, indicating neither side of the contract carries a premium — a neutral reading that rules out the kind of one-sided leverage positioning that can accelerate moves. Open interest stood at 67,552.01 contracts, with a notional value of approximately $4,746,584, down 0.26% over 24 hours. The symmetry with the price decline suggests net positioning held broadly stable rather than experiencing a meaningful flush or accumulation.
The Binance global account long/short ratio was 2.3245 as of 10:00 UTC on October 20, with 69.9% of tracked global accounts positioned long versus 30.1% short. Within Binance’s top-trader cohort, the skew was more pronounced: 76.8% long versus 23.2% short, producing a ratio of 3.3029 at the same observation time. These figures describe positioning within specific Binance cohorts and do not reflect shareholder positioning in the underlying equity or broader institutional conviction.
The taker buy/sell ratio over the 1-hour period ending near observation was 0.6072, with buy volume of 962 contracts against sell volume of 1,584 — aggressive market-order sellers outpacing buyers by roughly 1.65-to-1. That imbalance reflects who was actively hitting bids versus lifting offers in the near-term window, and it stands in contrast to the long-skewed account ratios. Those two data points measure different things: standing account positioning versus live aggressive order flow. Their divergence does not resolve cleanly into a single directional thesis, but near-term execution pressure was tilted toward the sell side at the time of observation.
Conditional Scenarios and Invalidation
The MACD convergence, neutral RSI, and the contract’s position above the pivot but below all short-term moving averages collectively describe a technical inflection rather than an established trend. Two conditional paths follow from the supplied levels.
To the upside, a reclaim and hold above immediate resistance at $70.93 would shift focus to strong resistance at $71.58. A failure to push through $70.93 with conviction would leave the pivot at $70.04 as the immediate directional arbiter.
To the downside, a breach of the pivot at $70.04 and a close below immediate support at $69.39 would bring the strong support floor at $68.50 into view. Given the negative taker flow, the MACD held in bearish territory, and the contract’s position below its short-term moving averages, buyers carry the near-term burden of proof.
For traders considering the bearish case conditional on a rejection at current levels:
Scenario: Rejection from below immediate resistance, trend continuation lower; Direction: short; Entry: $70.29; Stop: $70.93; Target: $68.50; Reward/risk: 2.80:1 (before fees, slippage and gaps).
The setup is invalidated on a clean daily close above $70.93. With an ATR of $1.47, gap risk is non-trivial relative to the $0.64 stop distance, and stops do not guarantee execution at the stated price. This is a derived scenario based on supplied levels, not an investment recommendation.