HOOD Price Prediction: Analyst Target Cuts and Fading October Volume Weigh on $86 Support Test

Home
Latest reporting
Price forecast
Three of seven sell-side analysts trimmed their price targets for Robinhood Markets on October 28, all citing softer October trading trends, yet every analyst in the group held a bullish rating on …
Market analysis includes conditional scenarios, not assured price outcomes or investment advice. Check the data, assumptions and dates cited.
Analyst Notes Reveal a Consensus That’s Bullish but Bracing
The seven analyst reports published on October 28, 2026 — sourced from Benzinga and MarketBeat — share a common thread: positive long-term conviction paired with a near-term reset. Three analysts cut targets, four held theirs, and none downgraded.
John Todaro at Needham & Company trimmed his target from $126 to $116 while keeping his Buy rating. His note, reported by Benzinga, flagged that October trading activity was trending “significantly below” the third-quarter average, even as adjusted EBITDA came in ahead of consensus. Alex Markgraff at KeyBanc Capital Markets also cut, reducing his Overweight target from $140 to $135. He characterised the results as mixed: healthy volumes were offset by lower monetization attributed to product mix. Lance Jessurun at Scotiabank lowered his Sector Outperform target from $136 to $124 without providing detailed commentary beyond the revision itself.
The four analysts who held their targets steady anchor the more constructive end of the range. Devin Ryan at Citizens JMP Securities retained the group’s highest target at $165 under a Market Outperform rating, per MarketBeat. Ramsey El-Assal at Cantor Fitzgerald reiterated Overweight with a $150 target. Chris Brendler at Rosenblatt Securities and Andrew Harte at BTIG both maintained Buy ratings and $135 targets, per Benzinga.
The spread from the lowest published target ($116, Needham) to the highest ($165, Citizens JMP) is wide enough to reflect genuine disagreement about the pace of earnings growth from here, not just different models. The shared concern among the three who cut was the October trading deceleration relative to Q3 averages. Whether that deceleration is seasonal noise or the early signal of a sustained slowdown is the pivotal question for the underlying equity. These targets carry no specific time horizons in the supplied reports.
It is also worth keeping the instrument distinction front of mind: these targets are for the NASDAQ-listed HOOD equity, not for the Binance-listed tokenized contract discussed below. The two trade on different venues, under different rules, and their prices reflect different liquidity conditions.
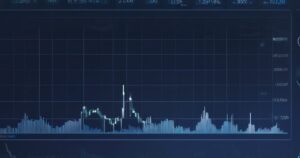
Hourly candlesticks (about 96 bars), same endpoint as our cryptocurrency price pages. Numbers below refresh from 1-minute klines.
More HOOD news, HOOD price prediction and analysis
A Price Below Every Average — The Technical Situation
The Binance tokenized stock was quoted at $86.14 at observation time, up 0.76% over the prior 24 hours against an intraday range of $85.15 to $86.19, per Binance futures data. All six moving averages in the supplied dataset sit above that print: the 7-day SMA at $88.09, the EMA 12 at $90.99, the 20-day SMA at $95.22, the EMA 26 at $96.97, the 200-day SMA at $97.97, and the 50-day SMA at $106.81. A price trading beneath every time frame’s average — including the 200-day — reflects a downtrend that has not found a structural floor in any of the standard reference periods.
The 14-period RSI stood at 30.47, just 0.47 points above the conventional oversold boundary of 30. The Stochastic oscillator, with %K at 18.95 and %D at 15.16, is already inside oversold territory by the standard sub-20 reading. Both indicators suggest that downside momentum has become stretched relative to recent price history, though neither independently constitutes a reversal signal in a persistent trend.
The MACD line and signal line both registered -5.9782 at observation time, with the histogram at 0.0000 — supplied data characterises this as bearish momentum. The convergence of the two lines at a deeply negative reading means the histogram has flattened without showing a cross or positive divergence, so no reversal impetus is yet visible in the MACD construct.
Bollinger Band positioning reinforces the picture: the %B reading of 0.1444 places the price just above the lower band at $82.45, against a midline (20-day SMA) at $95.22 and an upper band at $107.98. A %B below 0.2 signals proximity to the lower statistical boundary. The 14-period ATR of $4.38 provides a daily expected movement baseline; a single ATR swing down from current levels would bring the lower Bollinger Band into play.
Key reference levels from the supplied data: immediate resistance $86.50, strong resistance $86.87, pivot point $85.83, immediate support $85.46, strong support $84.79.
Derivatives Snapshot: Neutral Funding, Long-Skewed Accounts, Balanced Flow
Binance futures open interest stood at 135,050.87 contracts ($11.64 million notional) at observation time, up 1.09% over 24 hours — a modest build rather than a large positional shift. The 8-hour funding rate was exactly 0.0000%, indicating that neither long nor short holders were paying a carry premium at the most recent settlement, per Binance futures data.
Account-level positioning data captured at 10:00 UTC on November 1, 2026 showed Binance global accounts running 69.2% long versus 30.8% short (ratio 2.2478). Binance top-trader accounts were positioned even more heavily to the long side: 77.8% long against 22.2% short (ratio 3.4944). These figures describe the account composition of specific Binance cohorts at a single moment; they do not represent positioning in the underlying NASDAQ equity or shareholder behaviour more broadly.
The 1-hour taker buy/sell ratio of 0.9098, with 571 buy-side versus 628 sell-side contracts, is marginally skewed toward selling but practically balanced. Taken alongside the zero funding rate, the derivatives signals do not point to aggressive one-directional momentum in the contract at observation time.
Conflicting Signals, a Conditional Setup, and What Could Change the Picture
The central tension is between structural pressure and stretched readings. Price below all moving averages with a deeply negative MACD argues for continued distribution; Stochastic in oversold territory, RSI near 30, and %B close to the lower Bollinger Band signal that the move has become technically extended to the downside. These two conditions can coexist for longer than intuition suggests, particularly when the underlying equity story includes an identified fundamental headwind — in this case, the October trading slowdown named explicitly in three analyst notes.
The asymmetry in the near-term level structure defines the most directly observable setup. Strong resistance at $86.87 sits $0.73 above the current price; strong support at $84.79 sits $1.35 below. That imbalance, in the context of the prevailing trend, frames the following hypothetical scenario (not an investment recommendation):
Scenario: Continued decline below the pivot toward strong support; Direction: short; Entry: $86.14; Stop: $86.87; Target: $84.79; Reward/risk: 1.85:1 (before fees, slippage and gaps).
A sustained move through strong resistance at $86.87 would invalidate the immediate bearish structure. The next overhead reference in that case would be the EMA 12 at $90.99, followed by the 20-day SMA at $95.22. To the downside, a clean break of $84.79 would expose the lower Bollinger Band at $82.45 as the next support reference; stops placed at these levels do not guarantee execution prices.
The gap between the Binance contract price of $86.14 and even the lowest analyst equity target of $116 is substantial — roughly 35% as a simple arithmetic difference. Whether that gap reflects an opportunity or a trailing indicator of continued fundamental deterioration depends on how the October trading softness resolves. Three analysts revised their models lower in response to it; four did not. No dated catalyst for a definitive read on that question is available in the supplied evidence.