TRON Price Prediction: How Much Will TRX Be Worth in 2026 to 2030?
TRON price prediction points to steady growth ahead, with the coin showing resilience in a volatile crypto world. As of mid-February 2026, TRX trades around $0.278, up slightly from recent dips, thanks to ongoing network improvements and rising user activity.
Experts see potential for it to climb higher as more apps and services build on its fast, low-cost platform. This could make TRX a standout in the coming years, especially if broader market trends turn positive.
Below, we explore TRON’s past performance, current market position, technical outlook, and realistic price forecasts for 2026 through 2030.
TRON (TRX) Overview
Founded by Justin Sun in 2017, TRON is a blockchain platform designed to make digital content sharing easier and cheaper. It focuses on entertainment and apps, allowing creators to connect directly with fans without relying on big middlemen.
With fast transactions and low fees, it’s popular for gaming, video streaming, staking crypto, and online financial tools. TRX, its main coin, is used for payments and rewards on the network, helping it grow into one of the top cryptos by user base.
TRX Market Snapshot
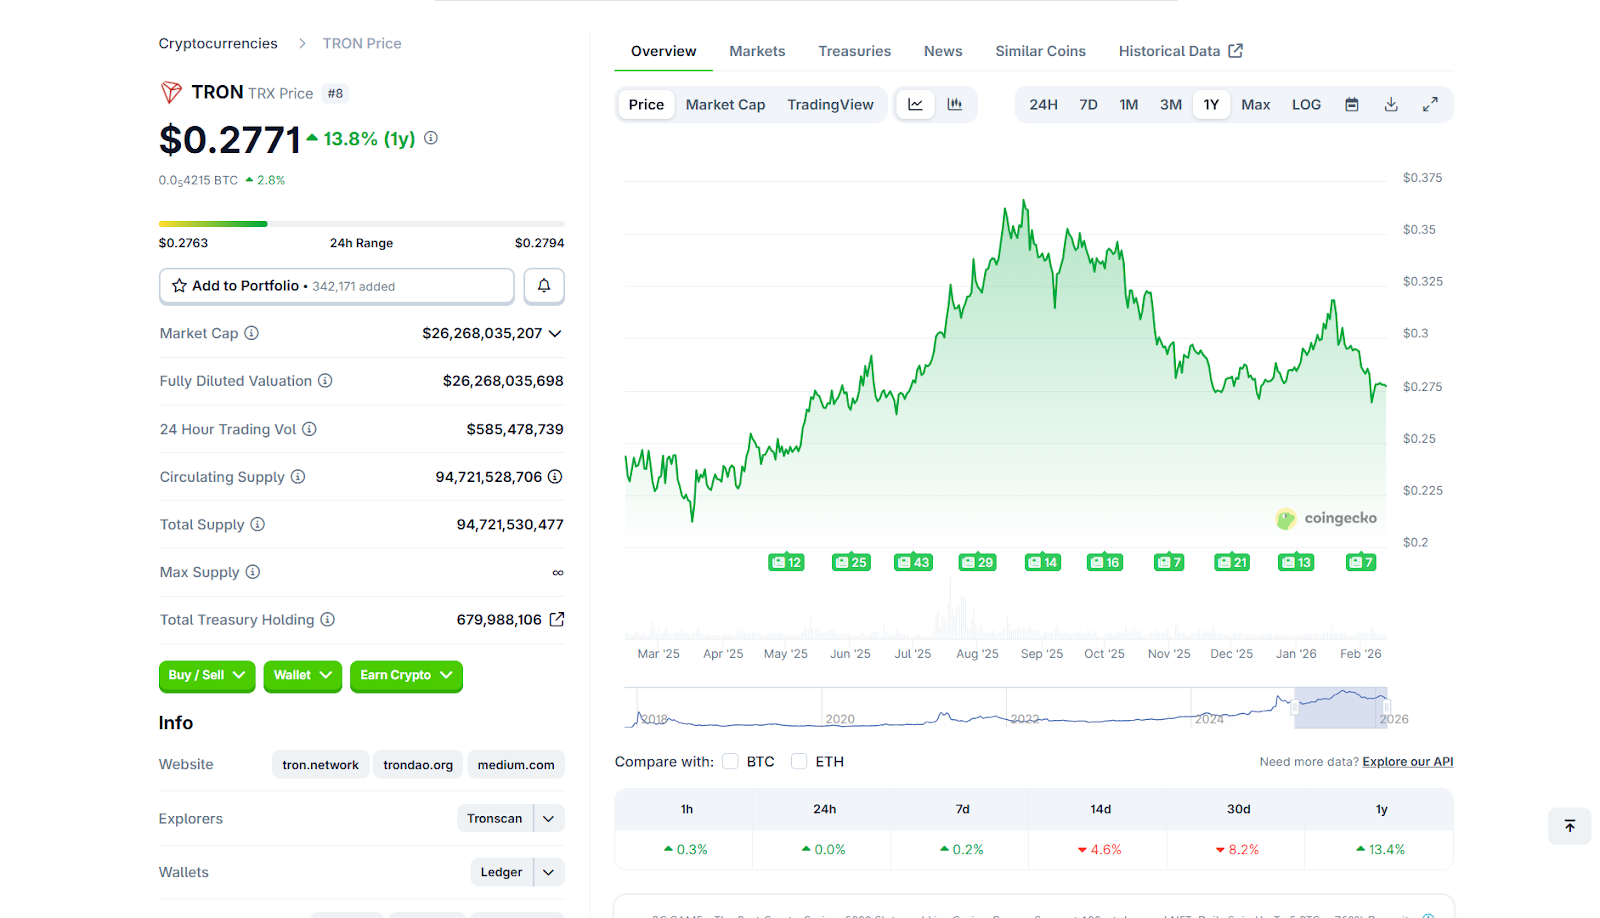
As of Feb 12, 2026, TRX has a market cap value of about $26 billion, ranking it among the top 10 cryptos. Daily trading volume hovers around $603 million, indicating strong interest from both buyers and sellers.
The total supply is over 94 billion coins, with most in circulation. Recent performance has been steady, with a small daily gain of about 1%. Still, the token has gone down slightly over the past week amid broader market caution.
TRX Price History and Performance
TRON has shown steady progress over the years, with price movements tied to market cycles and network milestones, leading to over 15,000% growth from its lowest points:
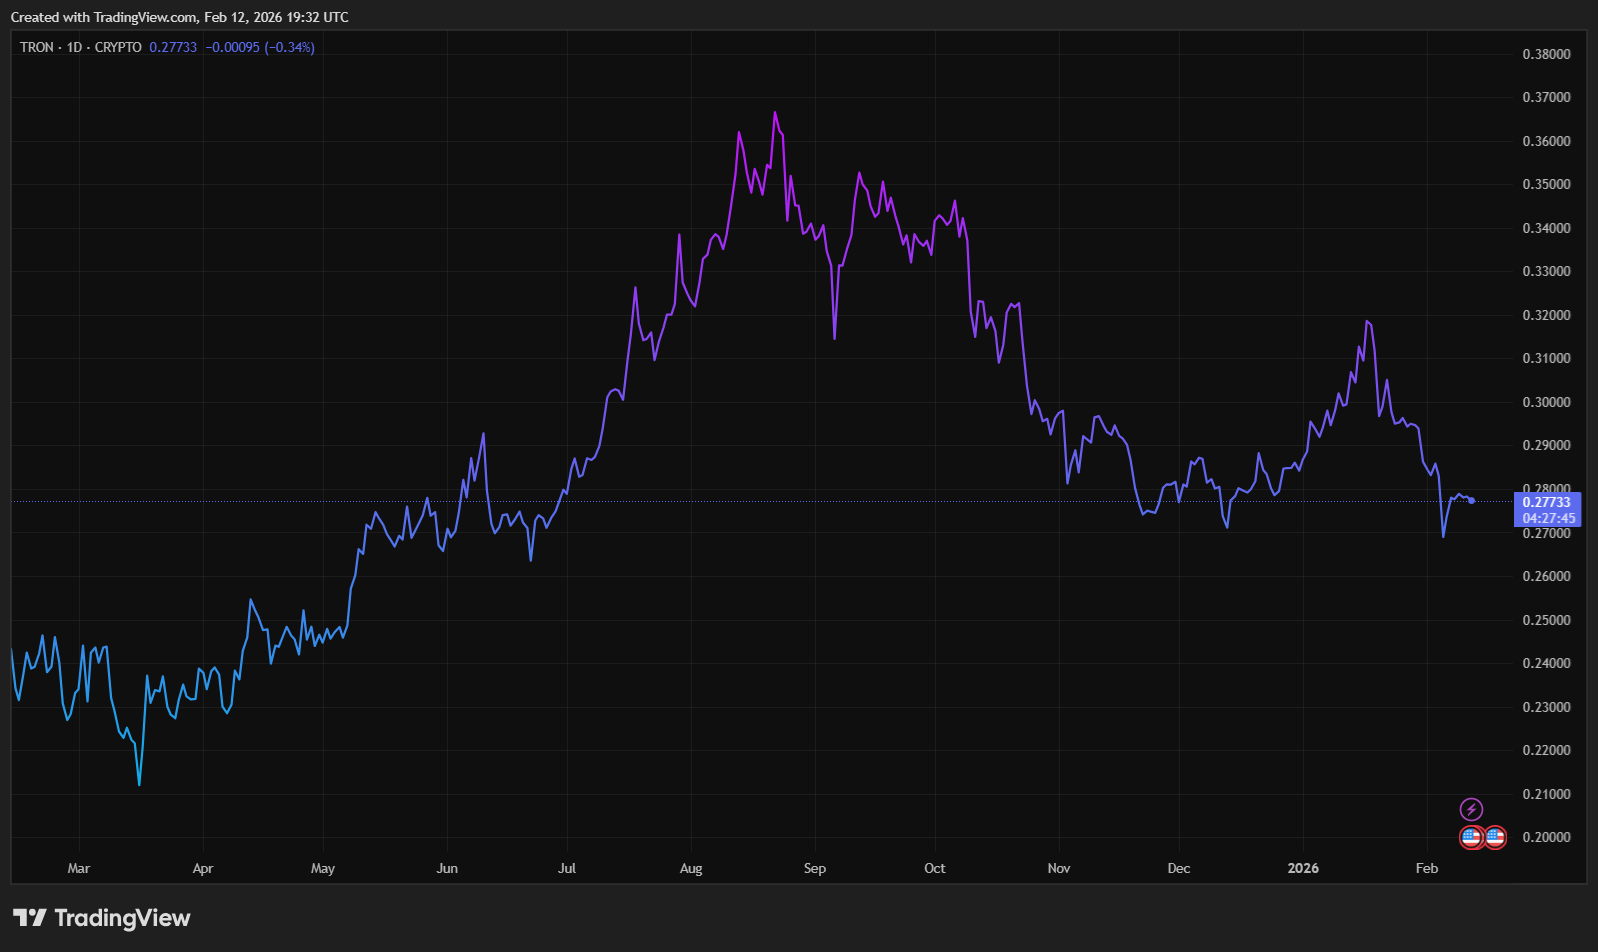
2017–2018 launch period: TRON entered the market during the crypto boom and quickly surged to about $0.30 in early 2018 before correcting with the broader market downturn.2019–2021 expansion phase: Growing DeFi activity and stablecoin usage helped TRX stabilize and climb gradually, reaching roughly $0.16 at its 2021 peak.2022 bear market: Like most cryptocurrencies, TRX declined during the global sell-off but remained relatively resilient compared with many altcoins.2023–2025 recovery: Strong network activity and rising stablecoin transfers supported steady growth, pushing TRX back toward the $0.30–$0.35 range.2026 current price: At the time of writing, TRX trades around $0.278, with a 24-hour increase of +1.50%.
Overall, TRON’s history shows slow, consistent growth driven by usage and ecosystem strength rather than hype-driven spikes.
TRON (TRX) Technical Analysis
Short-term technical indicators show balanced momentum rather than strong bullish or bearish pressure. TRX continues to hold key support while facing moderate resistance above current levels, keeping it in focus for investors looking for the best cryptocurrency to buy during consolidation phases.
Moving Averages
TRX is below its main averages. The 50-day at $0.29 and the 200-day at $0.31, suggesting consolidation rather than a clear breakout. A sustained move above the 200-day average would show that momentum is improving and sentiment is turning more bullish. Continued rejection at this level could keep TRX trading within a narrow range in the near term.
Relative Strength Index (RSI)
The RSI for TRX is currently hovering between 38 and 41 on daily charts, indicating a neutral stance that’s neither overbought nor deeply oversold. This suggests selling pressure could start to fade, potentially paving the way for a rebound if buyer interest picks up in the near term.
Key Price Levels
Trading Range (Speculative Short Term): $0.27–$0.29Critical Inflection Point: $0.275. Maintaining a position above this threshold could promote near-term balance. Dipping beneath it might open the door to additional downward pressure.Immediate Resistance: $0.28–$0.29. Pushing past this price range with more buying volume is key to starting fresh upward momentum.
Support Levels
Support LevelPrice (USD)S1$0.275S2$0.272S3$0.271S4$0.269S5$0.260
Resistance Levels
Resistance LevelPrice (USD)R1$0.280R2$0.281R3$0.284R4$0.290R5$0.300
TRON TRX Price Prediction 2026
MonthMinimum Price (USD)Average Price (USD)Maximum Price (USD)Expected ROI (%)January$0.27$0.29$0.314%February$0.28$0.30$0.327%March$0.29$0.31$0.331%April$0.30$0.32$0.3414%May$0.31$0.33$0.3518%June$0.32$0.34$0.3621%July$0.33$0.35$0.3725%August$0.34$0.36$0.3829%September$0.35$0.37$0.3932%October$0.36$0.38$0.4036%November$0.37$0.39$0.4139%December$0.38$0.40$0.4243%
You can also Read: Bonk Price Prediction 2026 to 2030: How High Can BONK Go?
TRX Price Prediction 2027
MonthMinimum Price (USD)Average Price (USD)Maximum Price (USD)Expected ROI (%)January$0.39$0.41$0.4346%February$0.40$0.42$0.4450%March$0.41$0.43$0.4554%April$0.42$0.44$0.4657%May$0.43$0.45$0.4761%June$0.44$0.46$0.4864%July$0.45$0.47$0.4968%August$0.46$0.48$0.5071%September$0.47$0.49$0.5175%October$0.48$0.50$0.5279%November$0.49$0.51$0.5382%December$0.50$0.52$0.5486%
TRX Price Prediction 2028
MonthMinimum Price (USD)Average Price (USD)Maximum Price (USD)Expected ROI (%)January$0.51$0.53$0.5589%February$0.52$0.54$0.5693%March$0.53$0.55$0.5796%April$0.54$0.56$0.58100%May$0.55$0.57$0.59104%June$0.56$0.58$0.60107%July$0.57$0.59$0.61111%August$0.58$0.60$0.62114%September$0.59$0.61$0.63118%October$0.60$0.62$0.64121%November$0.61$0.63$0.65125%December$0.62$0.64$0.66129%
Long-term Outlook: TRX Price Prediction for 2026, 2027, 2028, 2029, and 2030 (table)
YearMinimum Price (USD)Average Price (USD)Maximum Price (USD)Potential ROI (%)2026$0.27$0.35$0.4225%2027$0.39$0.46$0.5464%2028$0.51$0.58$0.66107%2029$0.60$0.68$0.75143%2030$0.65$0.75$0.85168%
Also Read: Solana Price Prediction 2026-2030
What Factors Influence TRON’s Price?
Several factors shape how TRX price moves over time. These influences come from both activity on the TRON network and the broader conditions across the crypto market:
Stablecoin usage and network demand: TRON handles a large share of global stablecoin transfers, especially USDT. Each transaction requires small amounts of TRX to process, which creates steady demand. When daily transactions and active users rise, the token’s usefulness increases, supporting price stability and gradual growth.Supply reduction through token burns: Part of the transaction fees on TRON is permanently removed from circulation. Over time, this shrinking supply can place upward pressure on prices, especially when network activity remains strong.Ongoing network improvements: Upgrades that make the TRON network faster, cheaper, or more useful tend to strengthen confidence. Better technology and smoother performance can encourage more activity, which may support long-term price growth.Partnerships and ecosystem expansion: New business partnerships, growing DeFi platforms, NFT projects, and other applications built on TRON all help expand real usage. Strong adoption signals long-term value and can improve expectations around future performance.Industry regulations: Government rules and legal actions often affect investor confidence. News involving regulators or leadership figures can quickly push prices down or trigger short-term volatility, even when the underlying network remains active.Market trends: Like most cryptocurrencies, TRX reacts to overall market sentiment. When the broader market feels optimistic, prices often rise. Large holders can also influence short-term swings if they move significant amounts of tokens at once.Global economic conditions: Interest rates, inflation trends, and worldwide liquidity shape how much money flows into digital assets. During uncertain economic periods, investors may reduce exposure to crypto, which can weigh on current price levels.
Final Thoughts
TRON (TRX) has earned a strong place in the crypto world. Its focus on high-volume transactions, stablecoin support, and a growing ecosystem of DeFi and NFT projects gives it real-world utility.
TRX’s price often follows network activity and broader market trends. Short-term swings are common and are influenced by regulatory news or global economic shifts. Despite this, TRON has shown resilience over time.
For investors, keeping an eye on both network fundamentals and market data trends is essential. With steady adoption, ongoing upgrades, and continued demand, TRX has the potential for gradual long-term growth. Volatility remains, but its underlying utility offers a foundation for the future.
FAQs
Will TRX go up in 2026?
TRX could rise modestly if adoption and market sentiment remain positive. According to experts, the TRON coin prediction for 2026 is $0.27 to $0.42, averaging $0.35. Stability remains its biggest strength.
Can TRON (TRX) reach $10?
Reaching $10 is extremely unlikely in the near term given TRX’s current price around $0.30 and its total supply. Such a milestone would require massive adoption, high demand, and sustained bullish market cycles. Investors should be realistic about long-term growth potential.
What will TRON be worth in 5 years?
In five years, around 2031, TRX might average $0.80-1.00, with highs to $1.20 in upbeat scenarios. This assumes steady network expansion and favorable financial markets, offering solid returns but depending on broader crypto health
What factors influence TRX’s price the most?
TRX price is shaped by network activity, stablecoin transactions, token burns, partnerships, and general crypto market trends. Regulatory developments also impact short-term volatility. Tracking these drivers can help gauge potential price changes.
What are the biggest risks to a TRX price forecast?
TRX is available on most major cryptocurrency exchanges, including Binance, OKX, Kraken, KuCoin, and Coinbase. For security, store TRX in hardware wallets or reputable software wallets that support TRON. Always use two-factor authentication for added safety.