MSTR Stock Price Could Dip 40% Despite New Bitcoin Buy?

The MicroStrategy stock started the post-President’s Day session on a weak note. MSTR closed nearly 4% lower compared to its Feb. 13 (last Friday’s) close, reflecting renewed selling pressure despite positive corporate news.
This decline comes even after Strategy, previously MicroStrategy, added more Bitcoin, lowering its average purchase cost. However, charts now show that this latest BTC average drop didn’t mean much for the immediate fate of the MSTR. A much larger downside risk is forming beneath the surface.
Sponsored
Sponsored
MicroStrategy’s Latest Bitcoin Buy Lowers Average Cost Only Slightly
MicroStrategy recently purchased 2,486 Bitcoin at an average price of $67,710. This latest acquisition increased its total holdings from 714,644 BTC earlier this month to 717,131 BTC.
Because this purchase was made below MicroStrategy’s previous average cost, it helped lower the company’s overall Bitcoin cost basis. MicroStrategy’s average acquisition price dropped from $76,052 (early this month) to $76,027 (at press time). This represents a $25 average cost reduction.
Want more token insights like this? Sign up for Editor Harsh Notariya’s Daily Crypto Newsletter here.
While this technically improves MicroStrategy’s balance sheet, the impact remains small relative to its total position.
The company still holds Bitcoin at an average cost above $76,000, which remains significantly higher than many earlier cycle acquisitions. More importantly, market indicators show that big money investors are not reacting positively, even to this development.
Sponsored
Sponsored
Capital Flow Signals Strategy Investors Remain Cautious
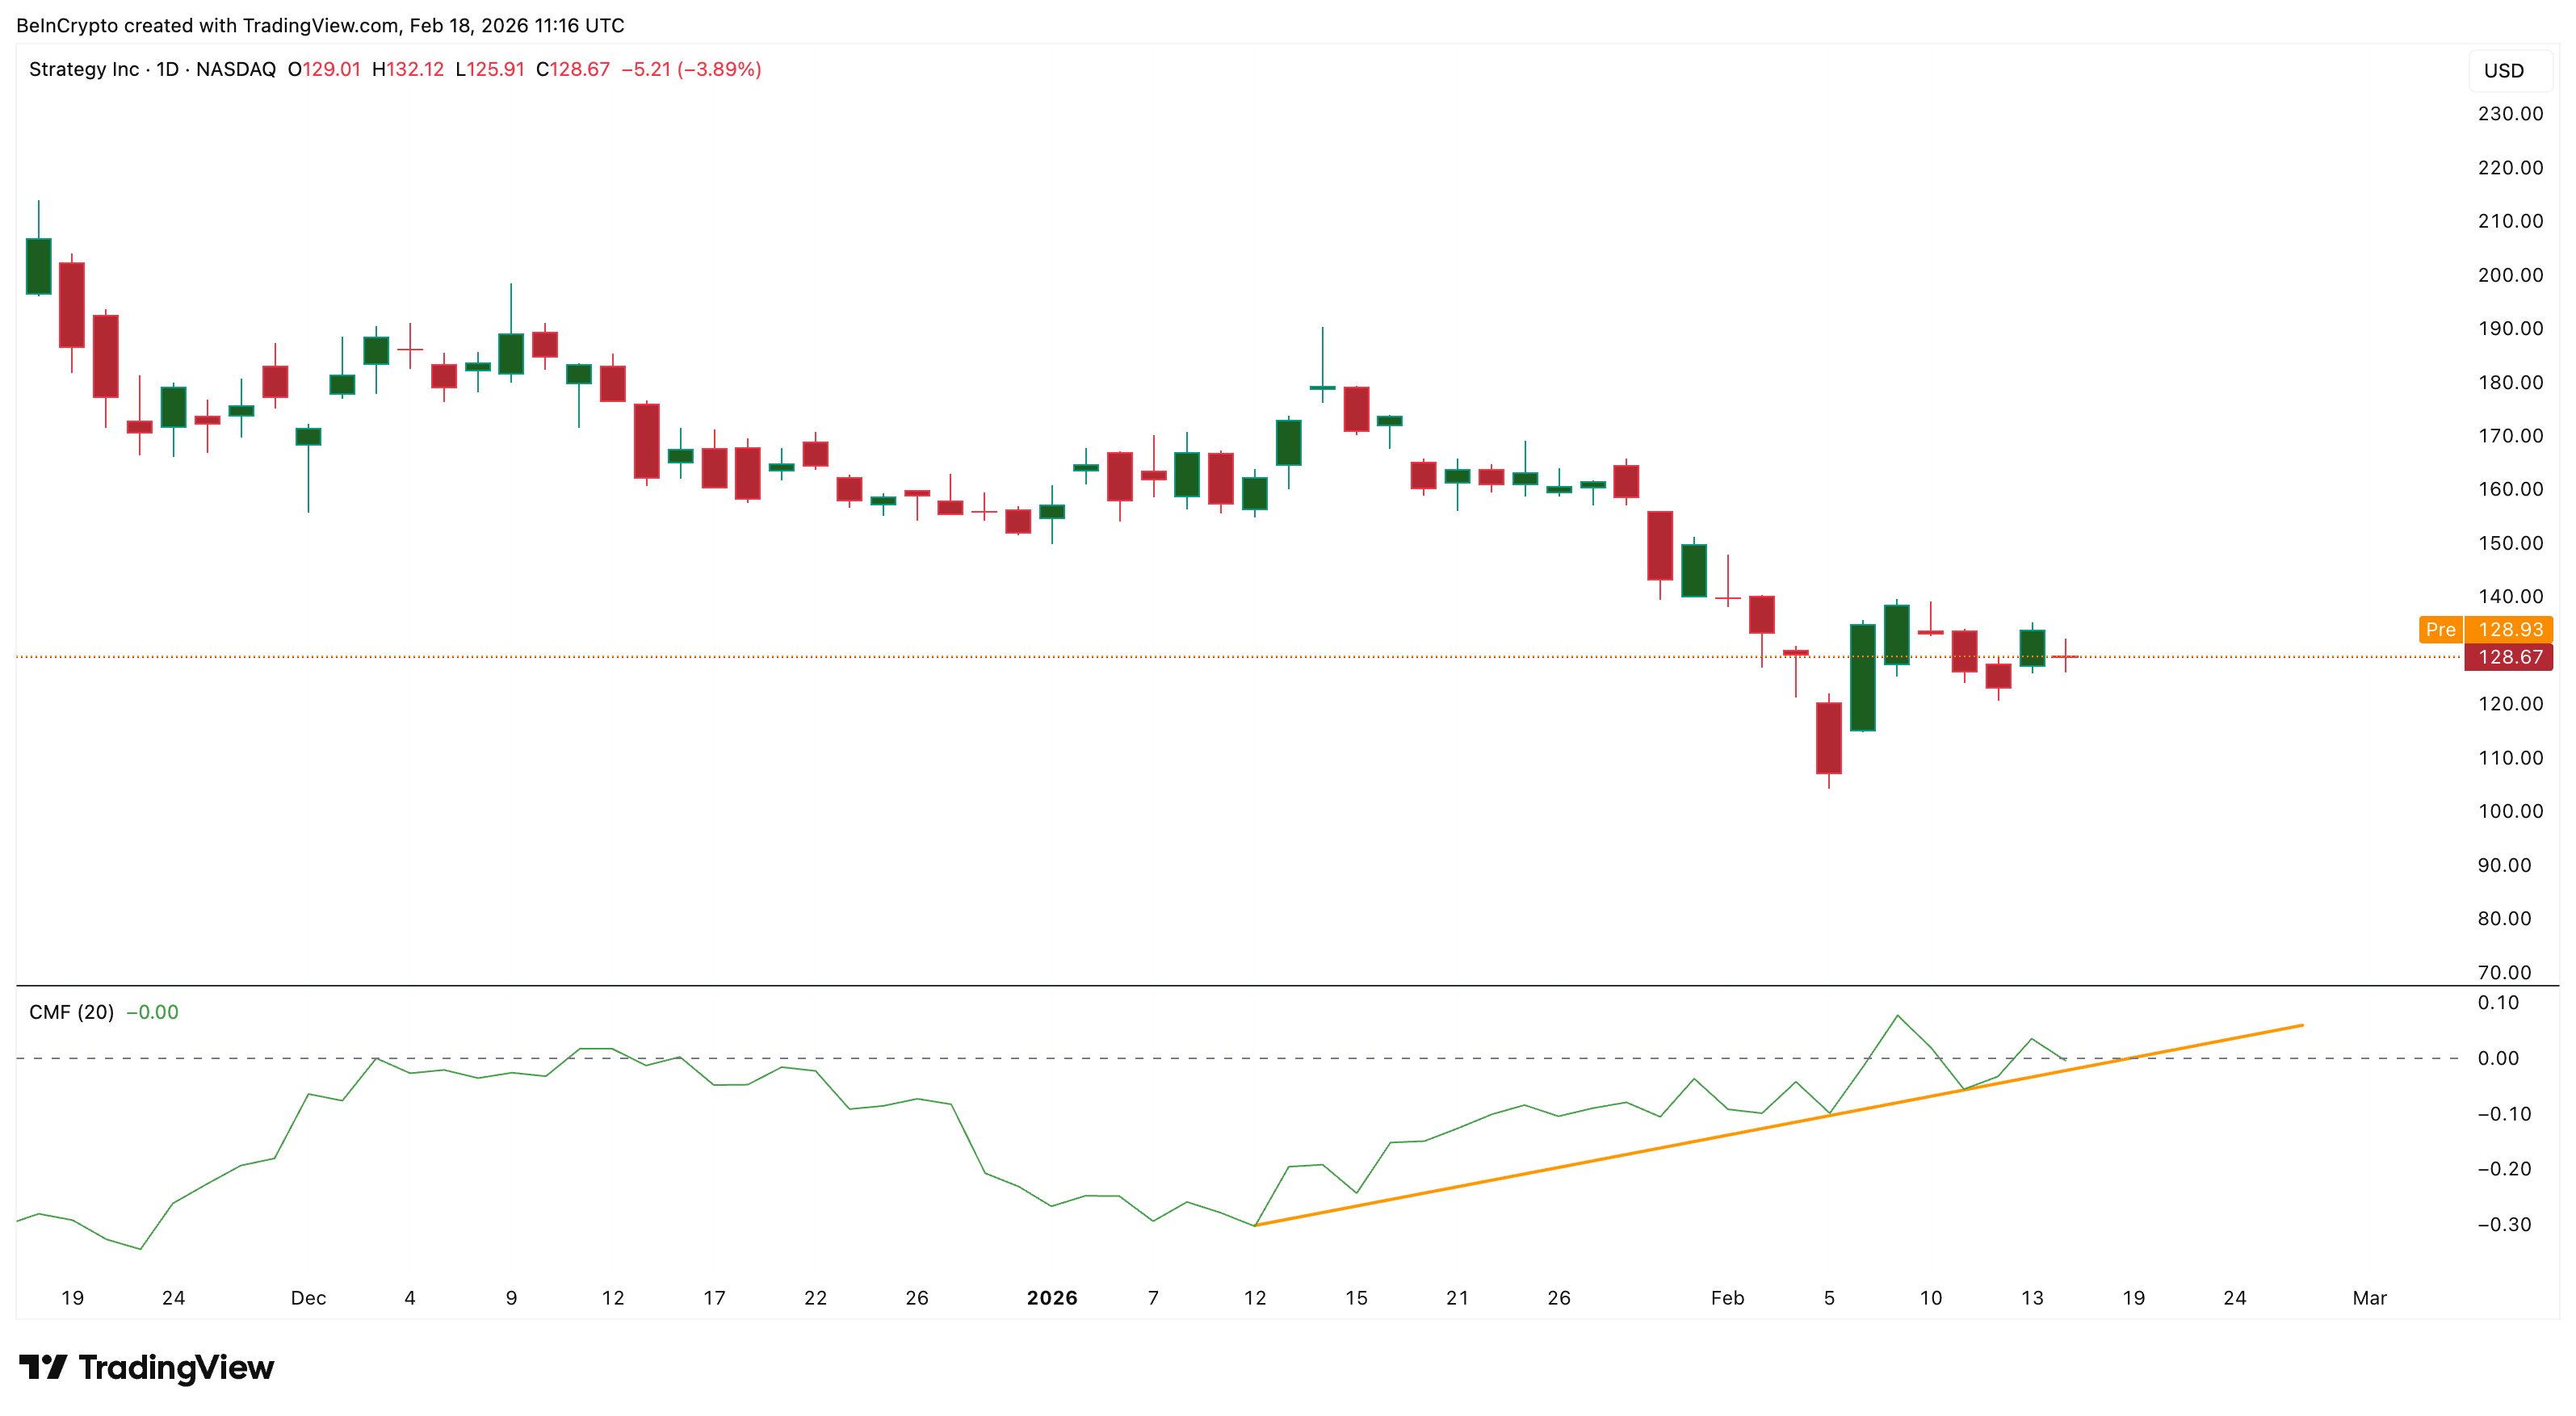
One key indicator explaining investor behavior is the Chaikin Money Flow, or CMF. This metric measures whether large investors are putting money into a stock or pulling money out by combining price and volume data. When CMF stays above zero, it signals net buying pressure. When it falls toward zero or below, it shows capital inflows are weakening.
Strategy’s CMF has been trending lower and is now sitting close to the zero line, on the brink of breaking below. It is also approaching a critical ascending trendline support. This shows that despite the latest Bitcoin purchase, large investors are not aggressively accumulating the MSTR stock. Instead, capital inflows remain weak.
This lack of conviction becomes more concerning when combined with weakening momentum signals.
Sponsored
Sponsored
Hidden Bearish Divergence Warns of Potential Major MSTR Price Correction
Momentum analysis using the Relative Strength Index, or RSI, shows a hidden bearish divergence forming. RSI measures buying and selling strength on a scale from 0 to 100 and helps identify weakening trends.
Between Dec. 9 and Feb. 13, MicroStrategy’s stock price formed a lower high, meaning the price failed to reach its previous peak. However, during the same period, RSI formed a higher high. This pattern is called hidden bearish divergence. It signals that sellers remain in control, and the downtrend is expected to continue. The MSTR stock price is down over 60% on a 6-month timeframe, highlighting the said downtrend.
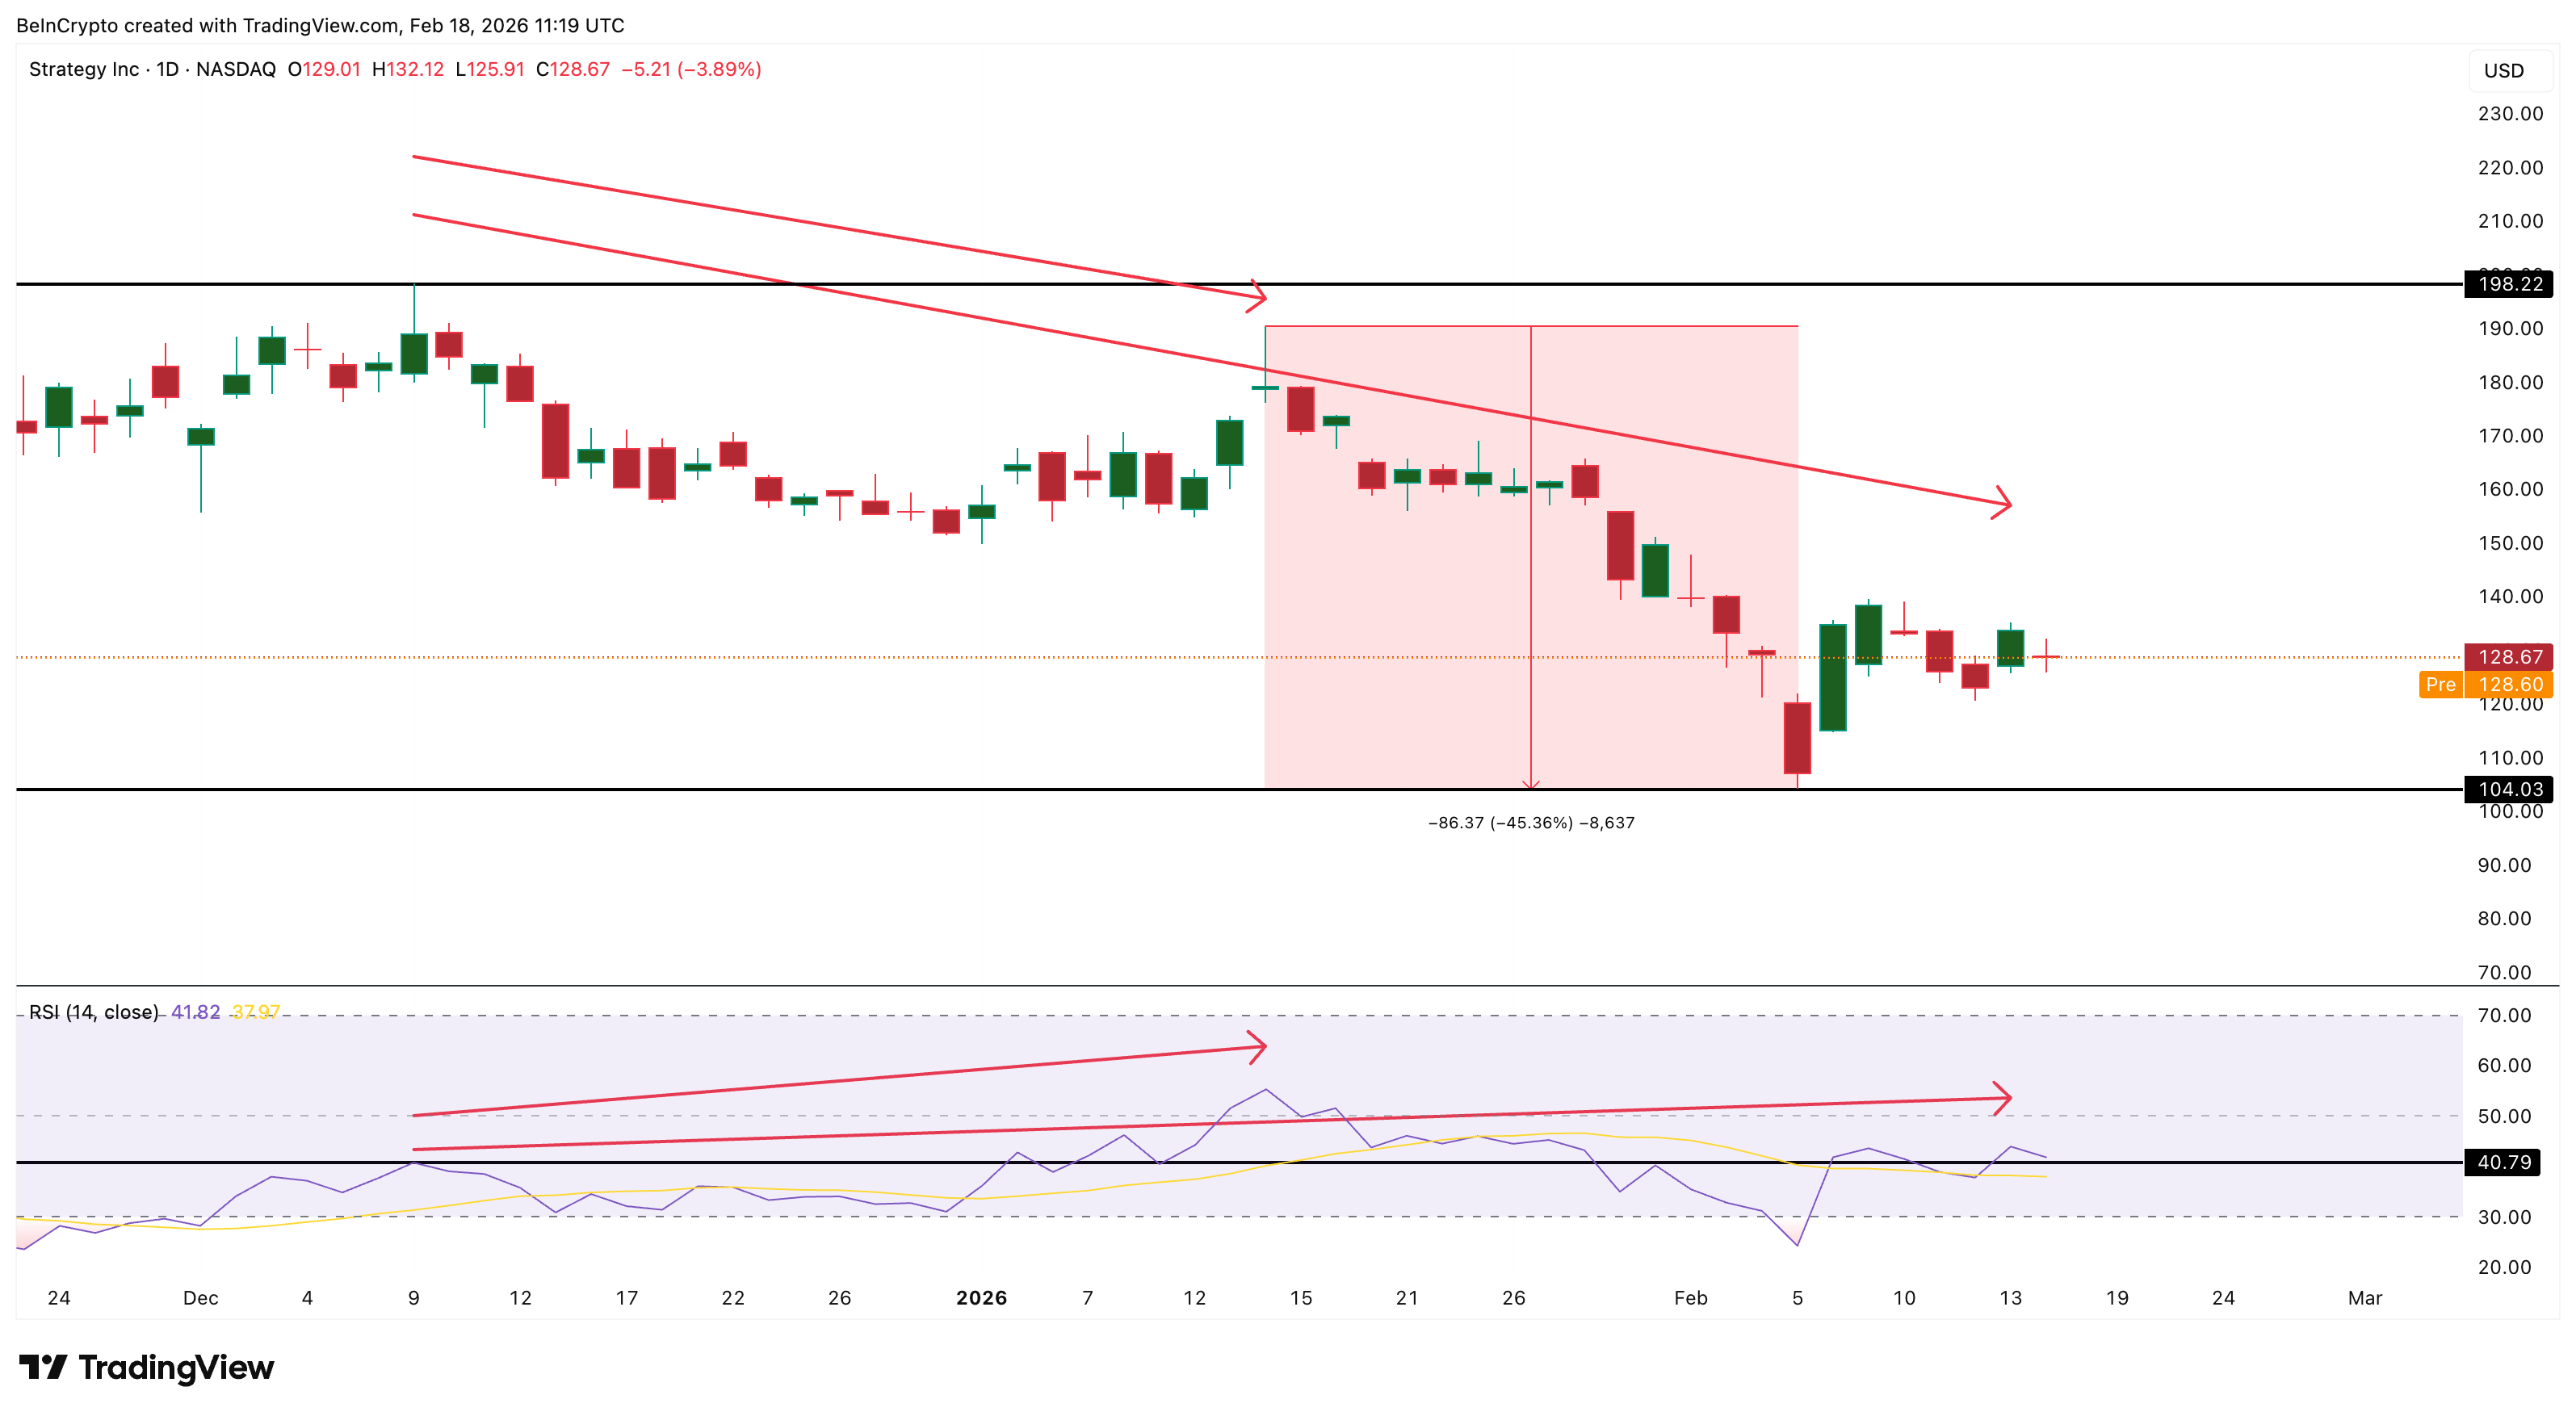
This same signal appeared earlier between Dec. 9 and Jan. 14. After that divergence formed, MicroStrategy stock dropped more than 45%, falling to its recent low near $104. The appearance of a similar structure now suggests another correction could develop if selling pressure continues. But this time the correction can have similar consequences.
Bear Flag Structure Shows MSTR Stock Could Fall Much Further
MicroStrategy’s price structure now shows a bear flag pattern forming. A bear flag is a bearish continuation pattern where the price temporarily moves upward before continuing its larger downtrend. After falling sharply earlier this February, the MSTR stock rebounded. However, this rebound has remained within a rising channel that forms the flag portion of the pattern.
Sponsored
Sponsored
MicroStrategy stock is currently trading near $128, very close to the lower boundary of this structure. If the price breaks below the $124 support level, the bear flag breakdown could begin.
Based on the height of the previous decline, this breakdown could push MicroStrategy stock toward $71, provided support levels at $104 and 86 break. This would represent a decline of more than 40% from current levels.
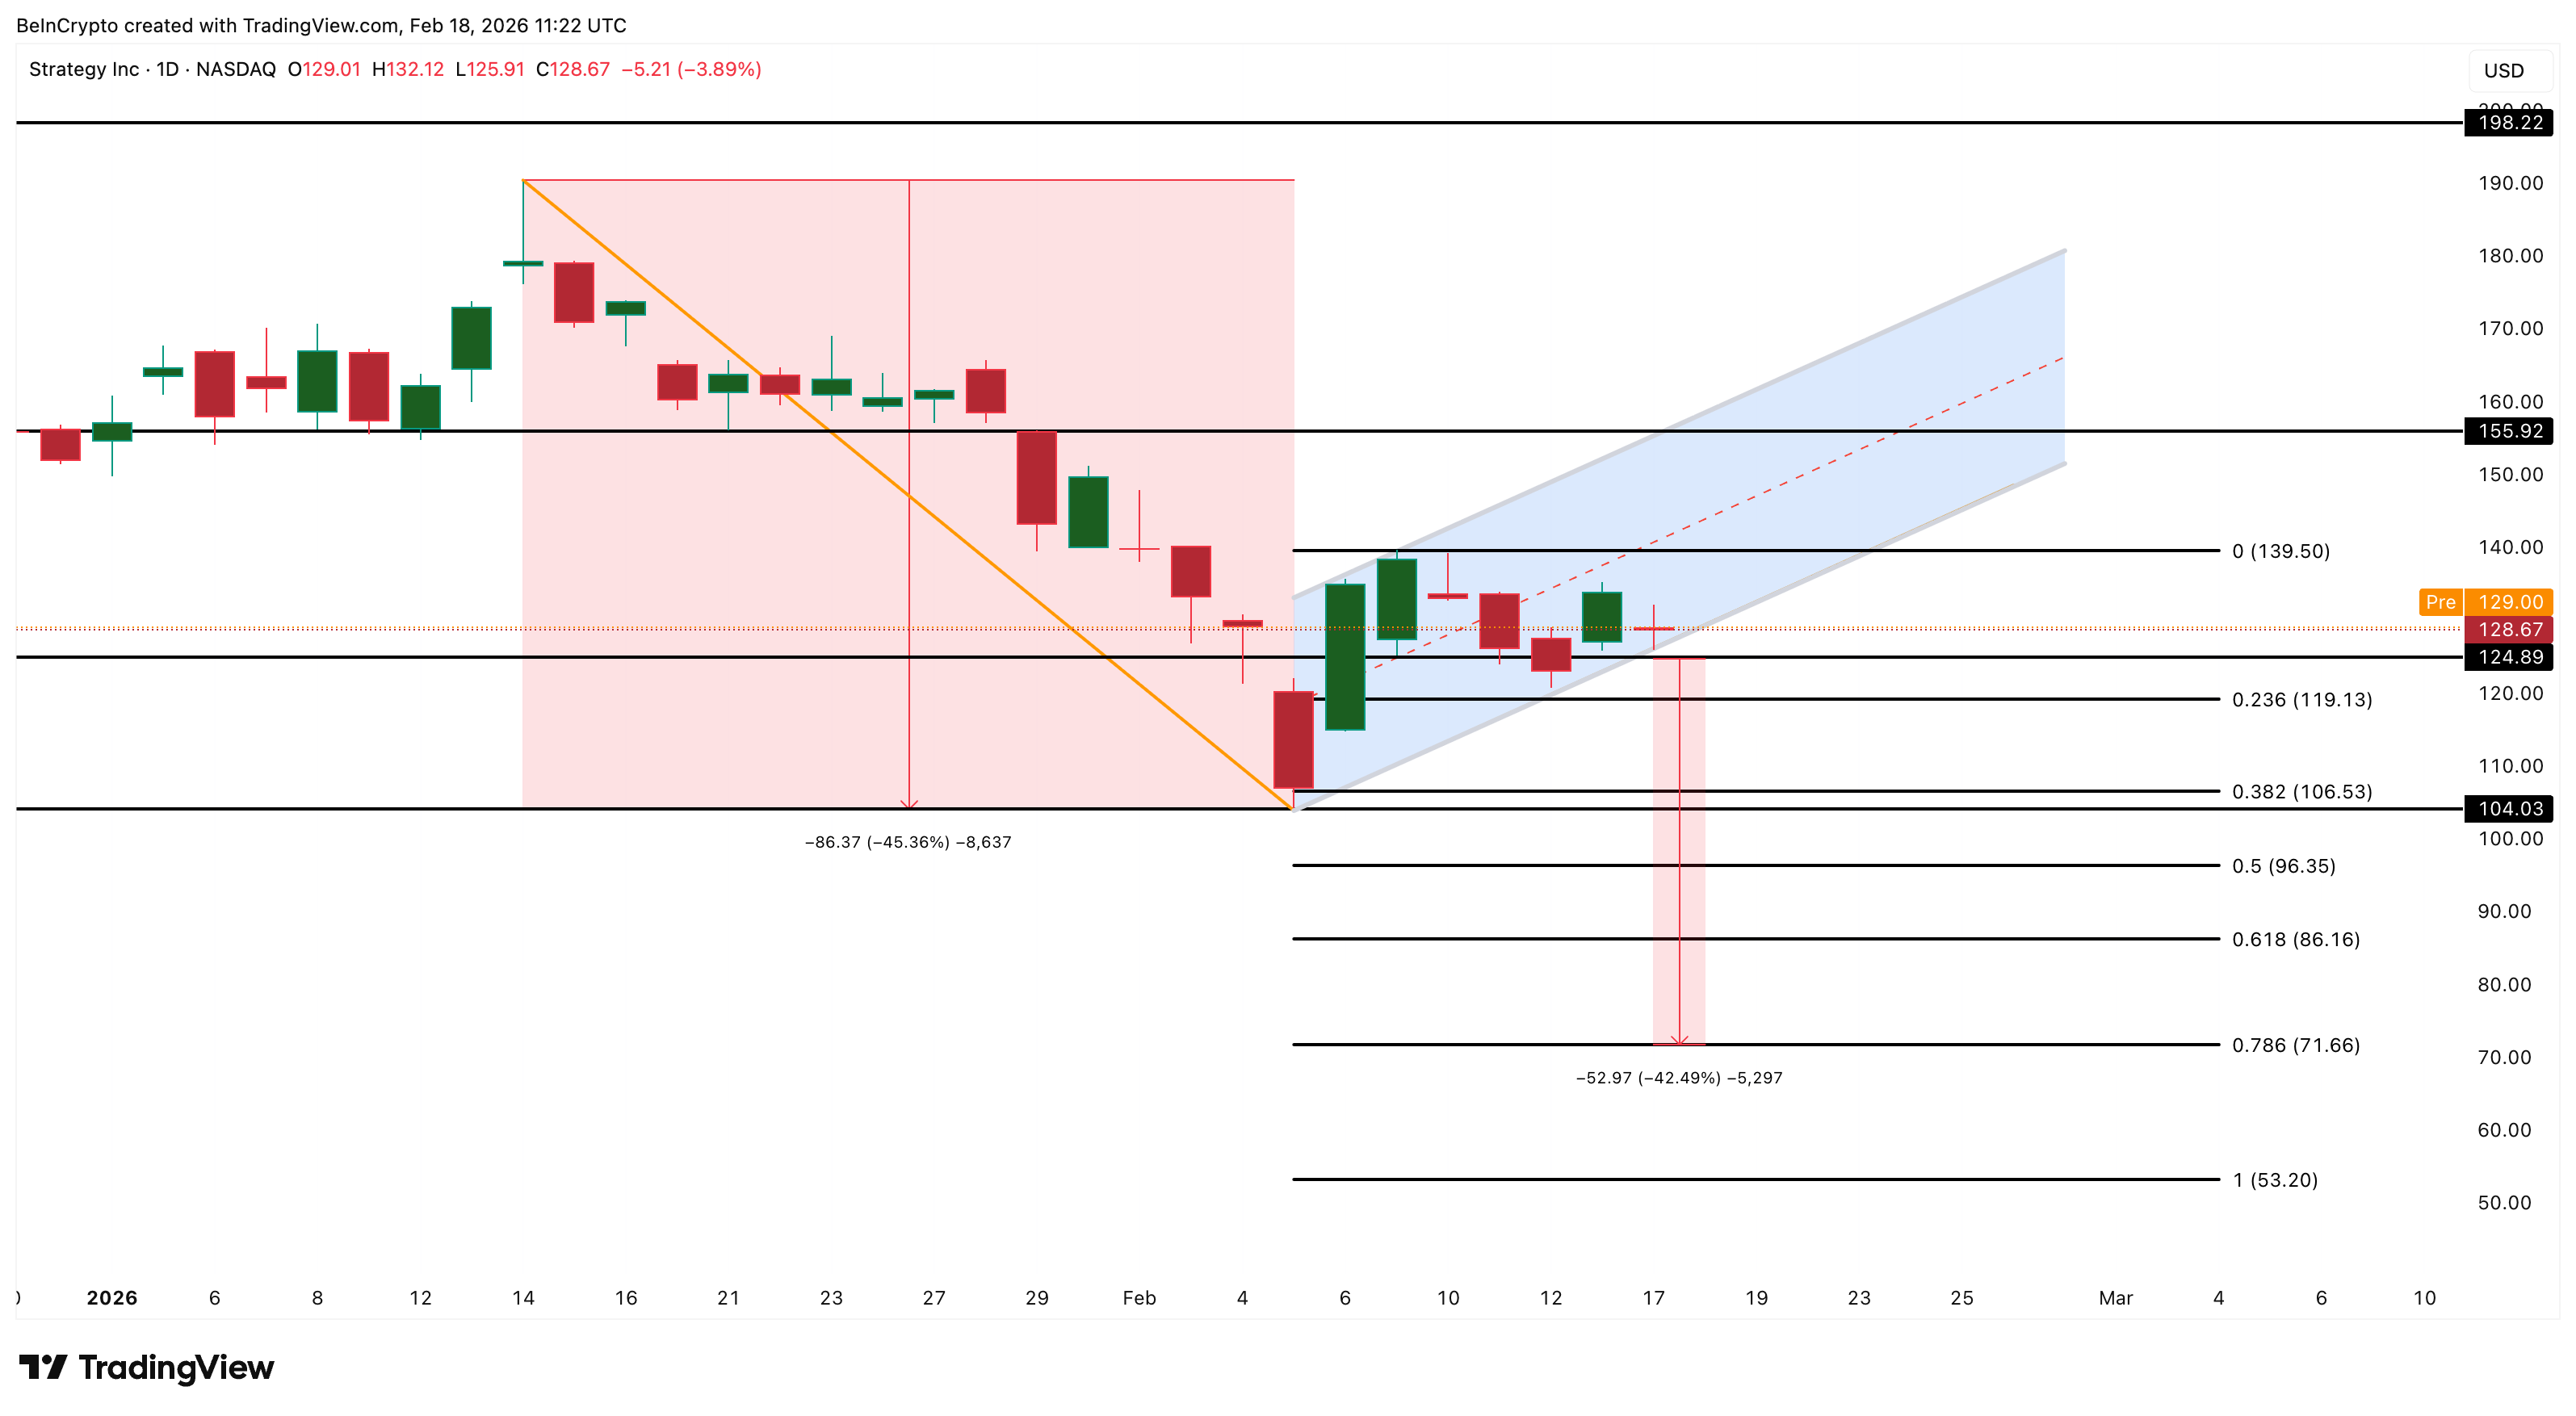
Recovery remains possible if buyers regain control. A move above $139 would weaken the bearish outlook, while a full recovery above $155 would invalidate the bearish structure entirely.
However, the bearish setup could also invalidate even without a sharp breakout. If the price continues rising slowly and the current channel extends beyond half of the original pole’s height, the bear flag would lose its validity. In that case, the structure would shift from a bearish continuation pattern into a broader recovery channel, reducing the immediate downside risk.
For now, MicroStrategy has successfully lowered its Bitcoin cost basis slightly. But capital flow weakness, bearish divergence, and fragile price structure all suggest that this small improvement may not be enough to prevent a larger stock correction.