Ethereum Whales Underwater—Is This the ETH Price Capitulation or a Calm Before a Strong Rebound?

After breaking above the local consolidation range near $1,950, the Ethereum price has pushed higher toward the psychological $2,000 level. ETH is trading around $1,988, up roughly 1.1% in the past 24 hours, slightly outperforming Bitcoin’s sub-1% move. The uptick appears to reflect a mild risk-on rotation into altcoins rather than any clear fundamental catalyst.
However, beneath the surface, on-chain data paints a more cautious picture. Despite the bounce, major ETH whale cohorts remain underwater on unrealized profits. If even large holders are still under pressure, the key question becomes whether this rally has real strength, or if Ethereum has yet to print its true cycle bottom.
All Ethereum Whale Cohorts Turn Underwater: A Cycle Reset Moment?
The chart tracking Ethereum whales’ unrealized profit ratio reveals a critical shift in market structure. For the first time this cycle, every major ETH holder group, from 1K–10K wallets to 100K+ ETH addresses, has entered unrealized losses. Historically, large cohorts tend to stay profitable during corrections, providing long-term support to the Ethereum price. But the current drawdown has pushed even the strongest hands below breakeven.
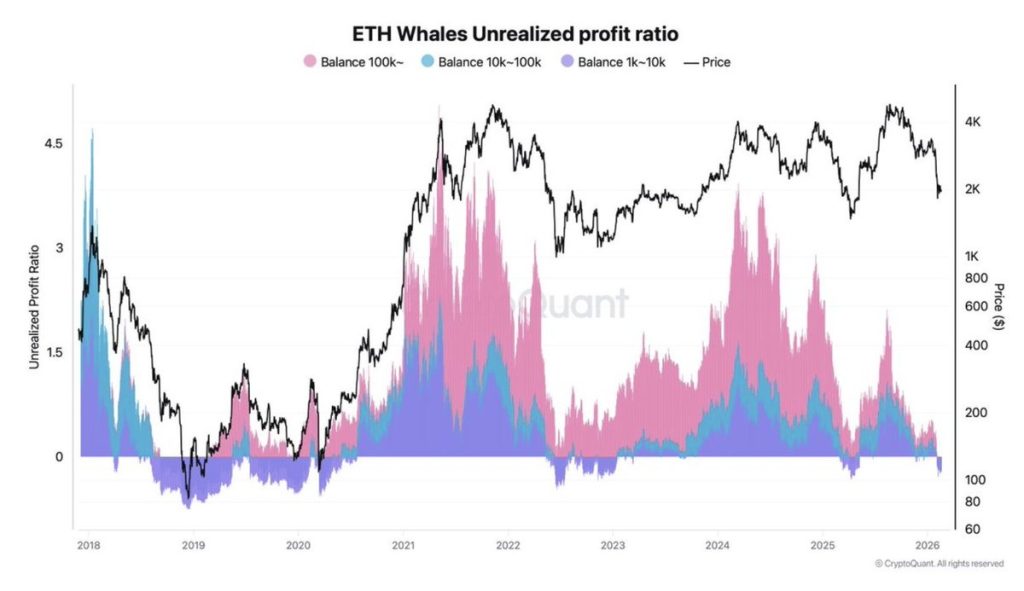
This development signals broad market stress rather than a simple retail shakeout. When whale wallets turn underwater, it often reflects deep capitulation conditions and late-stage cycle pressure. In previous cycles, similar resets have preceded major trend reversals, but only after volatility peaks and selling exhausts.
If Ethereum stabilises near current levels and whales resume accumulating, this zone could evolve into a long-term bottom. However, sustained weakness may prolong consolidation before a meaningful recovery unfolds.
Ethereum Price Analysis: Key Levels to Watch as Volatility Compresses
On the daily chart, Ethereum remains under pressure after breaking decisively below the $2,750–$2,800 demand zone, confirming a major structure breakdown. Price is now consolidating around $1,990, just below the 20-day SMA near $2,038, while the upper Bollinger Band sits around $2,260 — highlighting strong overhead resistance.
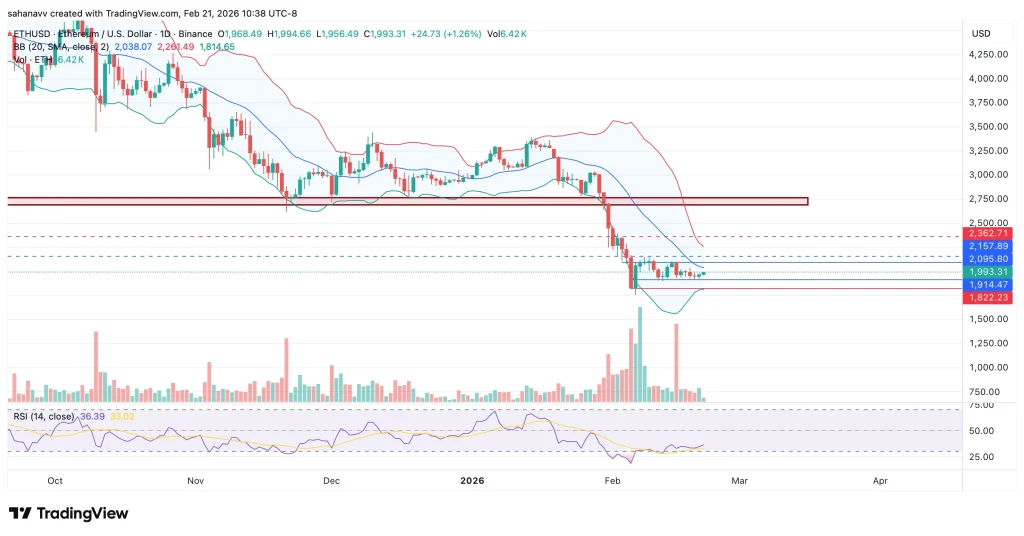
The lower Bollinger Band near $1,814 marked the recent capitulation wick low around $1,820–$1,850, which now acts as critical short-term support. A daily close below $1,914 could reopen downside toward $1,820, and a breakdown there exposes $1,700 next.
RSI is hovering near 36, recovering from oversold territory but still below the 50 midline — signaling weak bullish momentum. For bulls to regain control, ETH must reclaim $2,095 first, followed by a stronger breakout above $2,157. A sustained move above $2,260 would invalidate the immediate bearish bias and shift targets toward $2,360.
Until $2,157–$2,260 is reclaimed decisively, rallies are likely corrective rather than trend-reversing.
Trust with CoinPedia:
CoinPedia has been delivering accurate and timely cryptocurrency and blockchain updates since 2017. All content is created by our expert panel of analysts and journalists, following strict Editorial Guidelines based on E-E-A-T (Experience, Expertise, Authoritativeness, Trustworthiness). Every article is fact-checked against reputable sources to ensure accuracy, transparency, and reliability. Our review policy guarantees unbiased evaluations when recommending exchanges, platforms, or tools. We strive to provide timely updates about everything crypto & blockchain, right from startups to industry majors.
Investment Disclaimer:
All opinions and insights shared represent the author’s own views on current market conditions. Please do your own research before making investment decisions. Neither the writer nor the publication assumes responsibility for your financial choices.
Sponsored and Advertisements:
Sponsored content and affiliate links may appear on our site. Advertisements are marked clearly, and our editorial content remains entirely independent from our ad partners.