XRP Price Nears $2B Sell Wall — Breakout or Rejection?

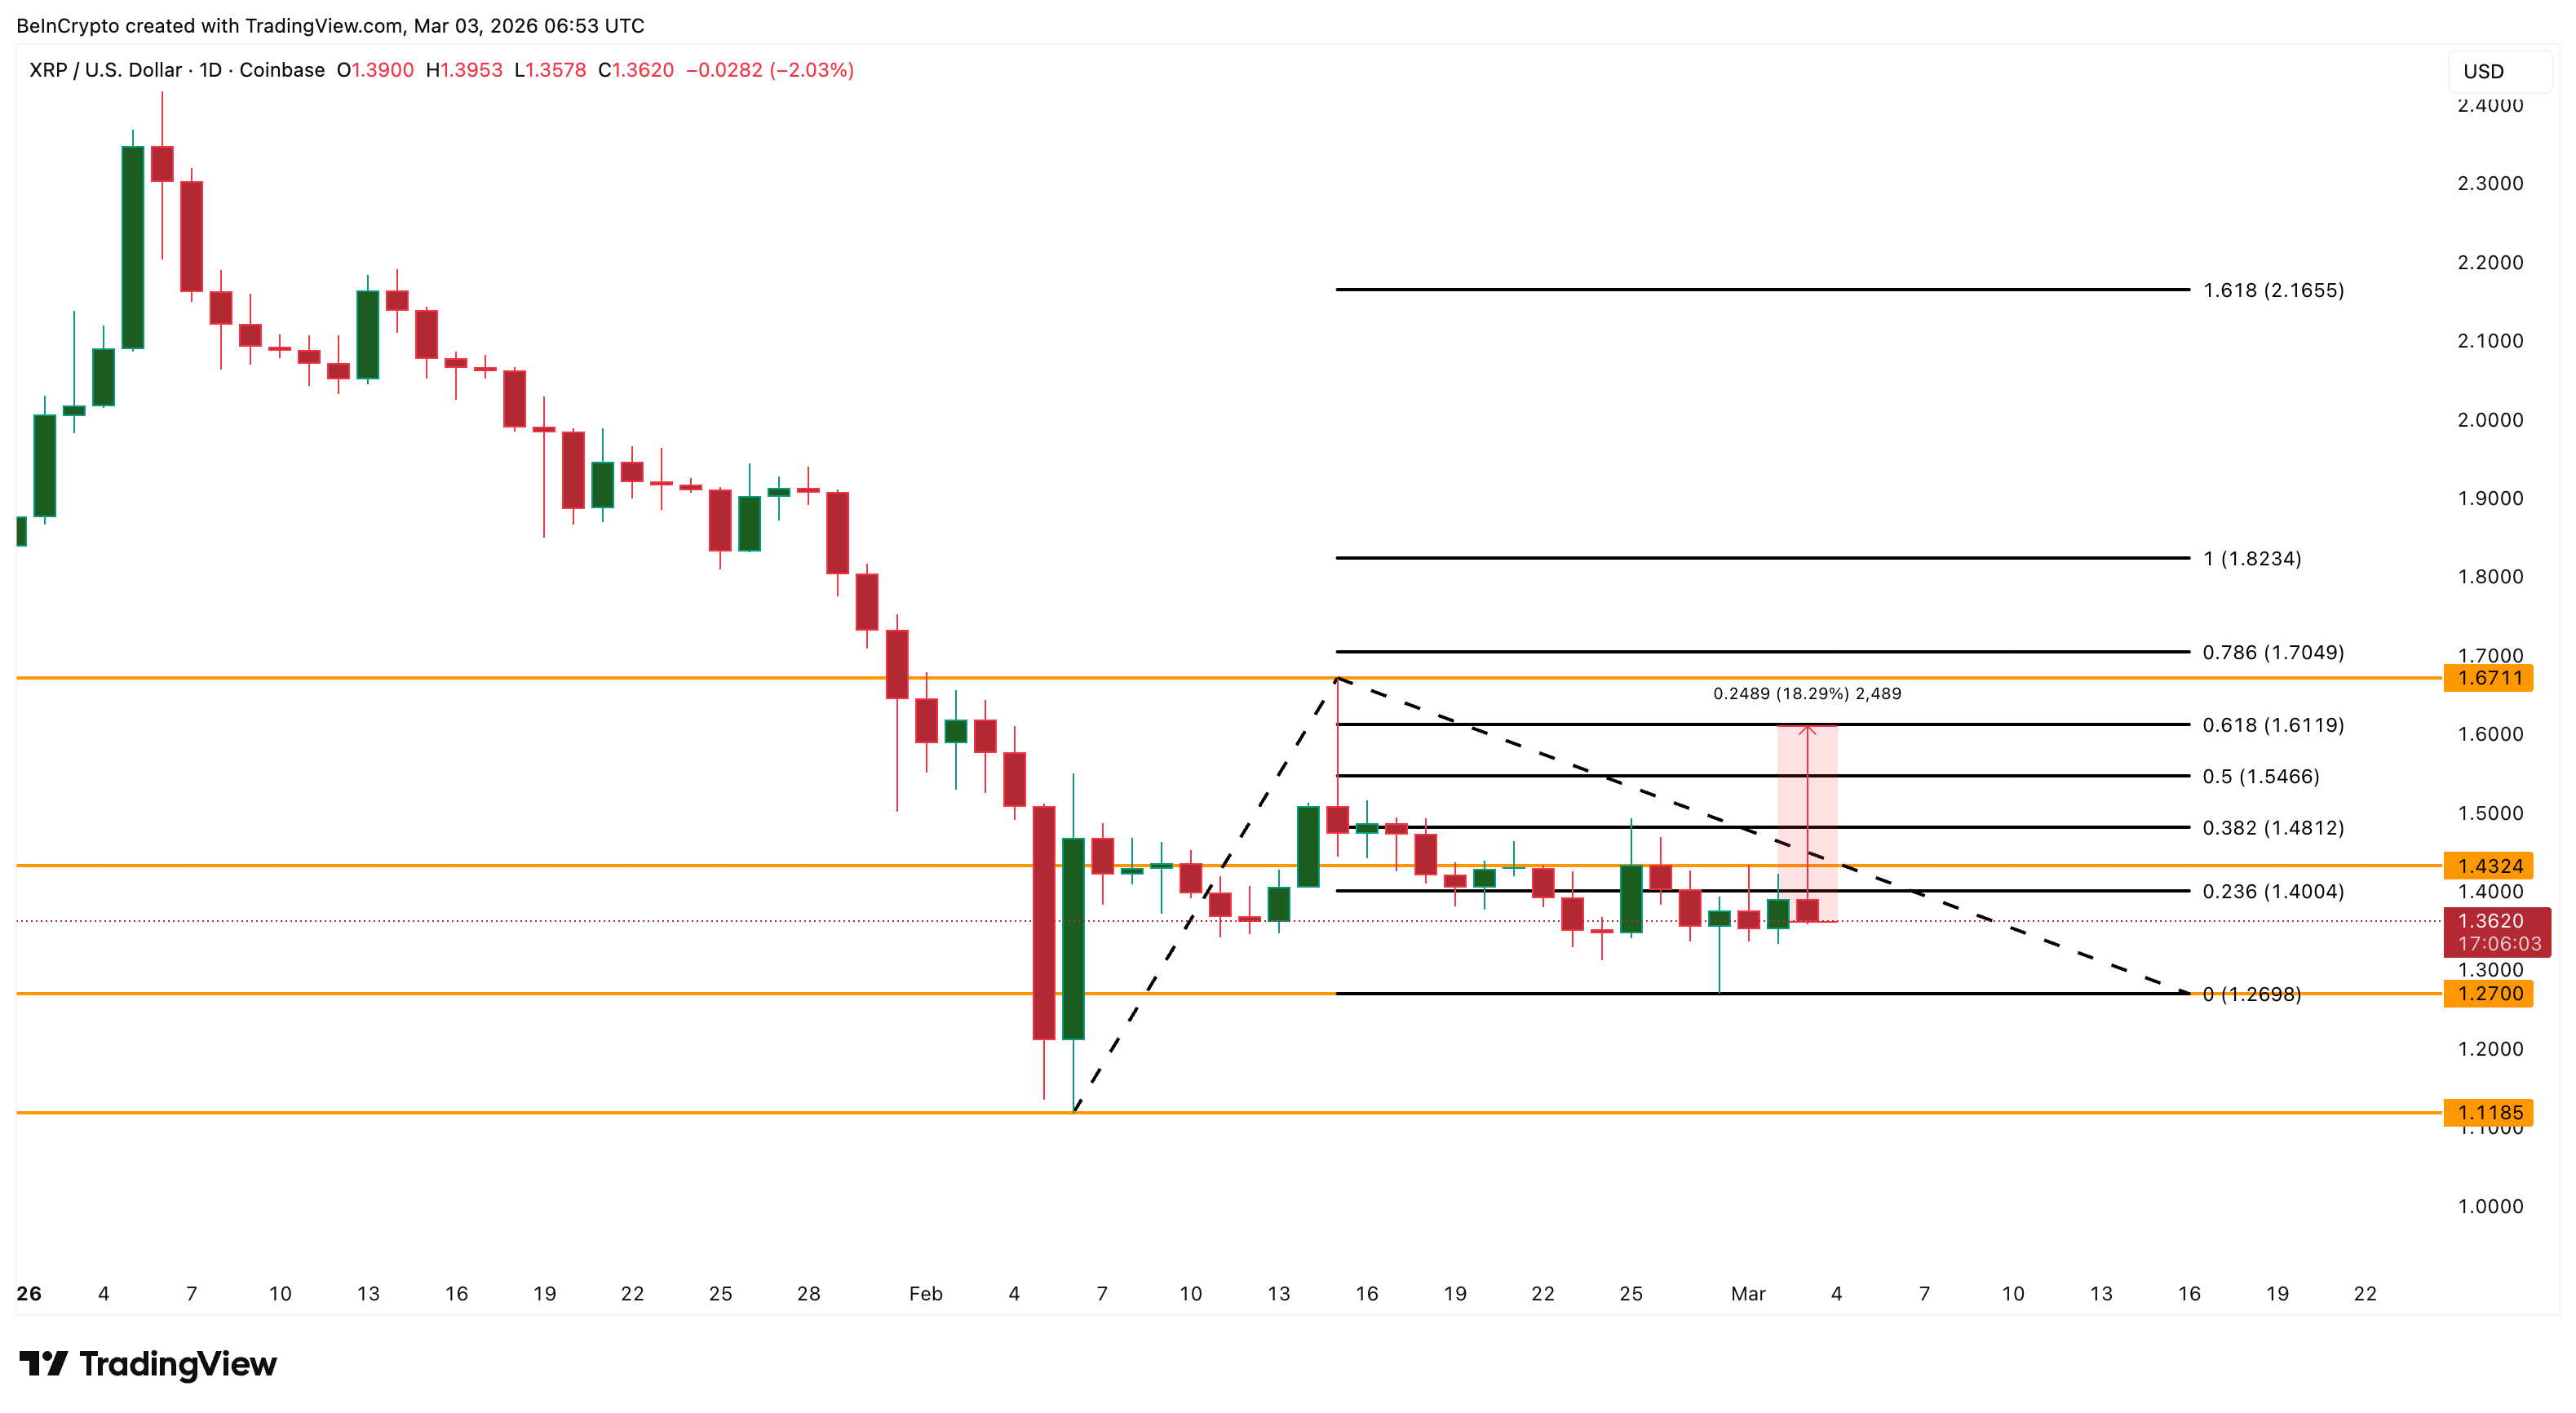
XRP price has started March with renewed momentum. After bottoming near $1.27 on February 28, XRP rebounded nearly 12%, climbing to $1.43 before stabilizing around $1.36. Even so, the broader structure remains weak. The token is still down roughly 18% over the past 30 days.
Price is compressing inside a defined range. And directly above it sits a major obstacle: more than 2 billion XRP in supply clustered near $1.60. For the first time in months, however, ETF flows, long-term holder behavior, and whale accumulation are beginning to align beneath that wall. But before discussing breakout potential, we must address the risk.
Bearish Divergence Keeps XRP Trapped Inside Its Range
Between February 6 and March 2, XRP formed a lower high on the daily chart. During the same period, the Relative Strength Index (RSI), a momentum indicator that measures the strength of price moves, formed a higher high. When price makes a lower high but RSI makes a higher high, this creates a hidden bearish divergence. It signals weakening structure and often appears before pullbacks.
That helps explain repeated XRP price movement between $1.43 and $1.27. Even the spike to $1.67 on February 15 was quickly sold into. Sellers stepped in aggressively. Momentum has not yet confirmed a breakout.
Want more token insights like this? Sign up for Editor Harsh Notariya’s Daily Crypto Newsletter here.
Yet despite this divergence, XRP has not broken below its range floor near $1.27. If momentum is on weak grounds, why is support holding? To answer that, we move beyond the chart.
ETF Inflows and Falling Liveliness Signal Conviction Is Returning
The first shift in conviction is now visible in XRP’s own ETF data.
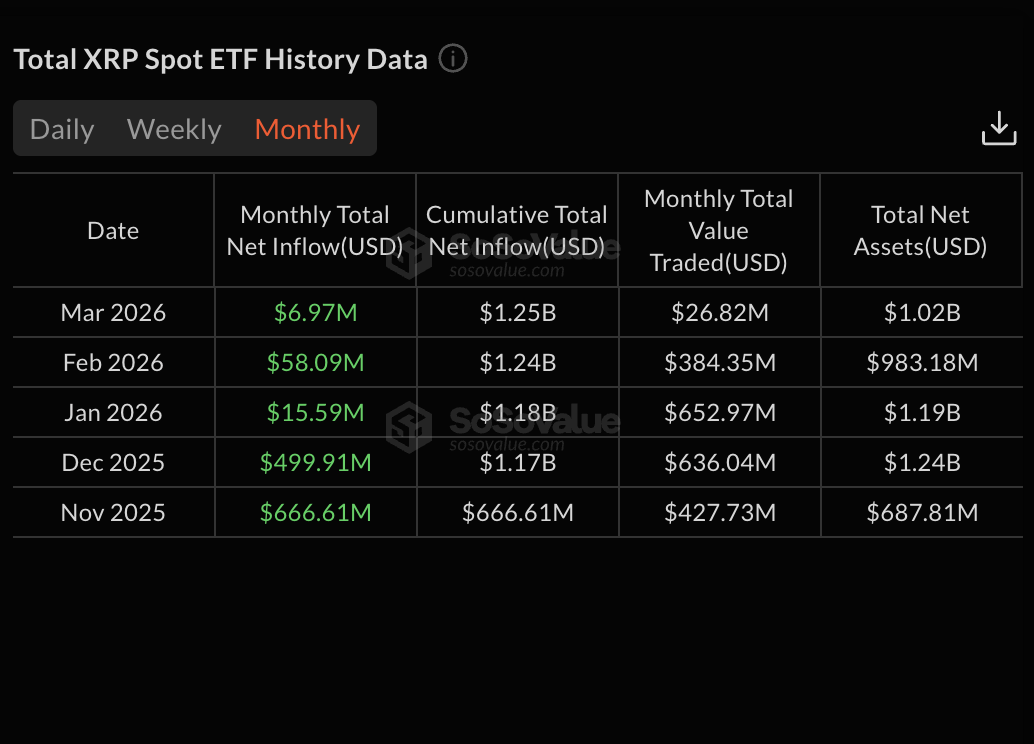
Exchange-Traded Funds reflect institutional participation. When net inflows are positive, capital is entering the asset. When flows slow, demand is fading. March 2026 has started with $6.97 million in net inflows. That may look modest, but context matters.
January recorded $15.59 million in inflows. February improved further to $58.09 million. Now, in just the first few days of March, XRP has already attracted nearly 45% of January’s total. That signals that institutional participation has not disappeared despite repeated price rejections.
So capital is entering.
At the same time, on-chain behavior is reinforcing this shift. XRP’s liveliness metric is declining. Liveliness measures the ratio of coins moved relative to total coins ever created. When liveliness rises, older coins are being spent. When it falls, long-term holders are likely to accumulate.
Since February 11, liveliness has dropped from 0.815 to 0.813. More importantly, liveliness is now closing in on the six-month-low. The last time it sat near these levels was mid-October, when XRP was trading above the $2.30 mark.
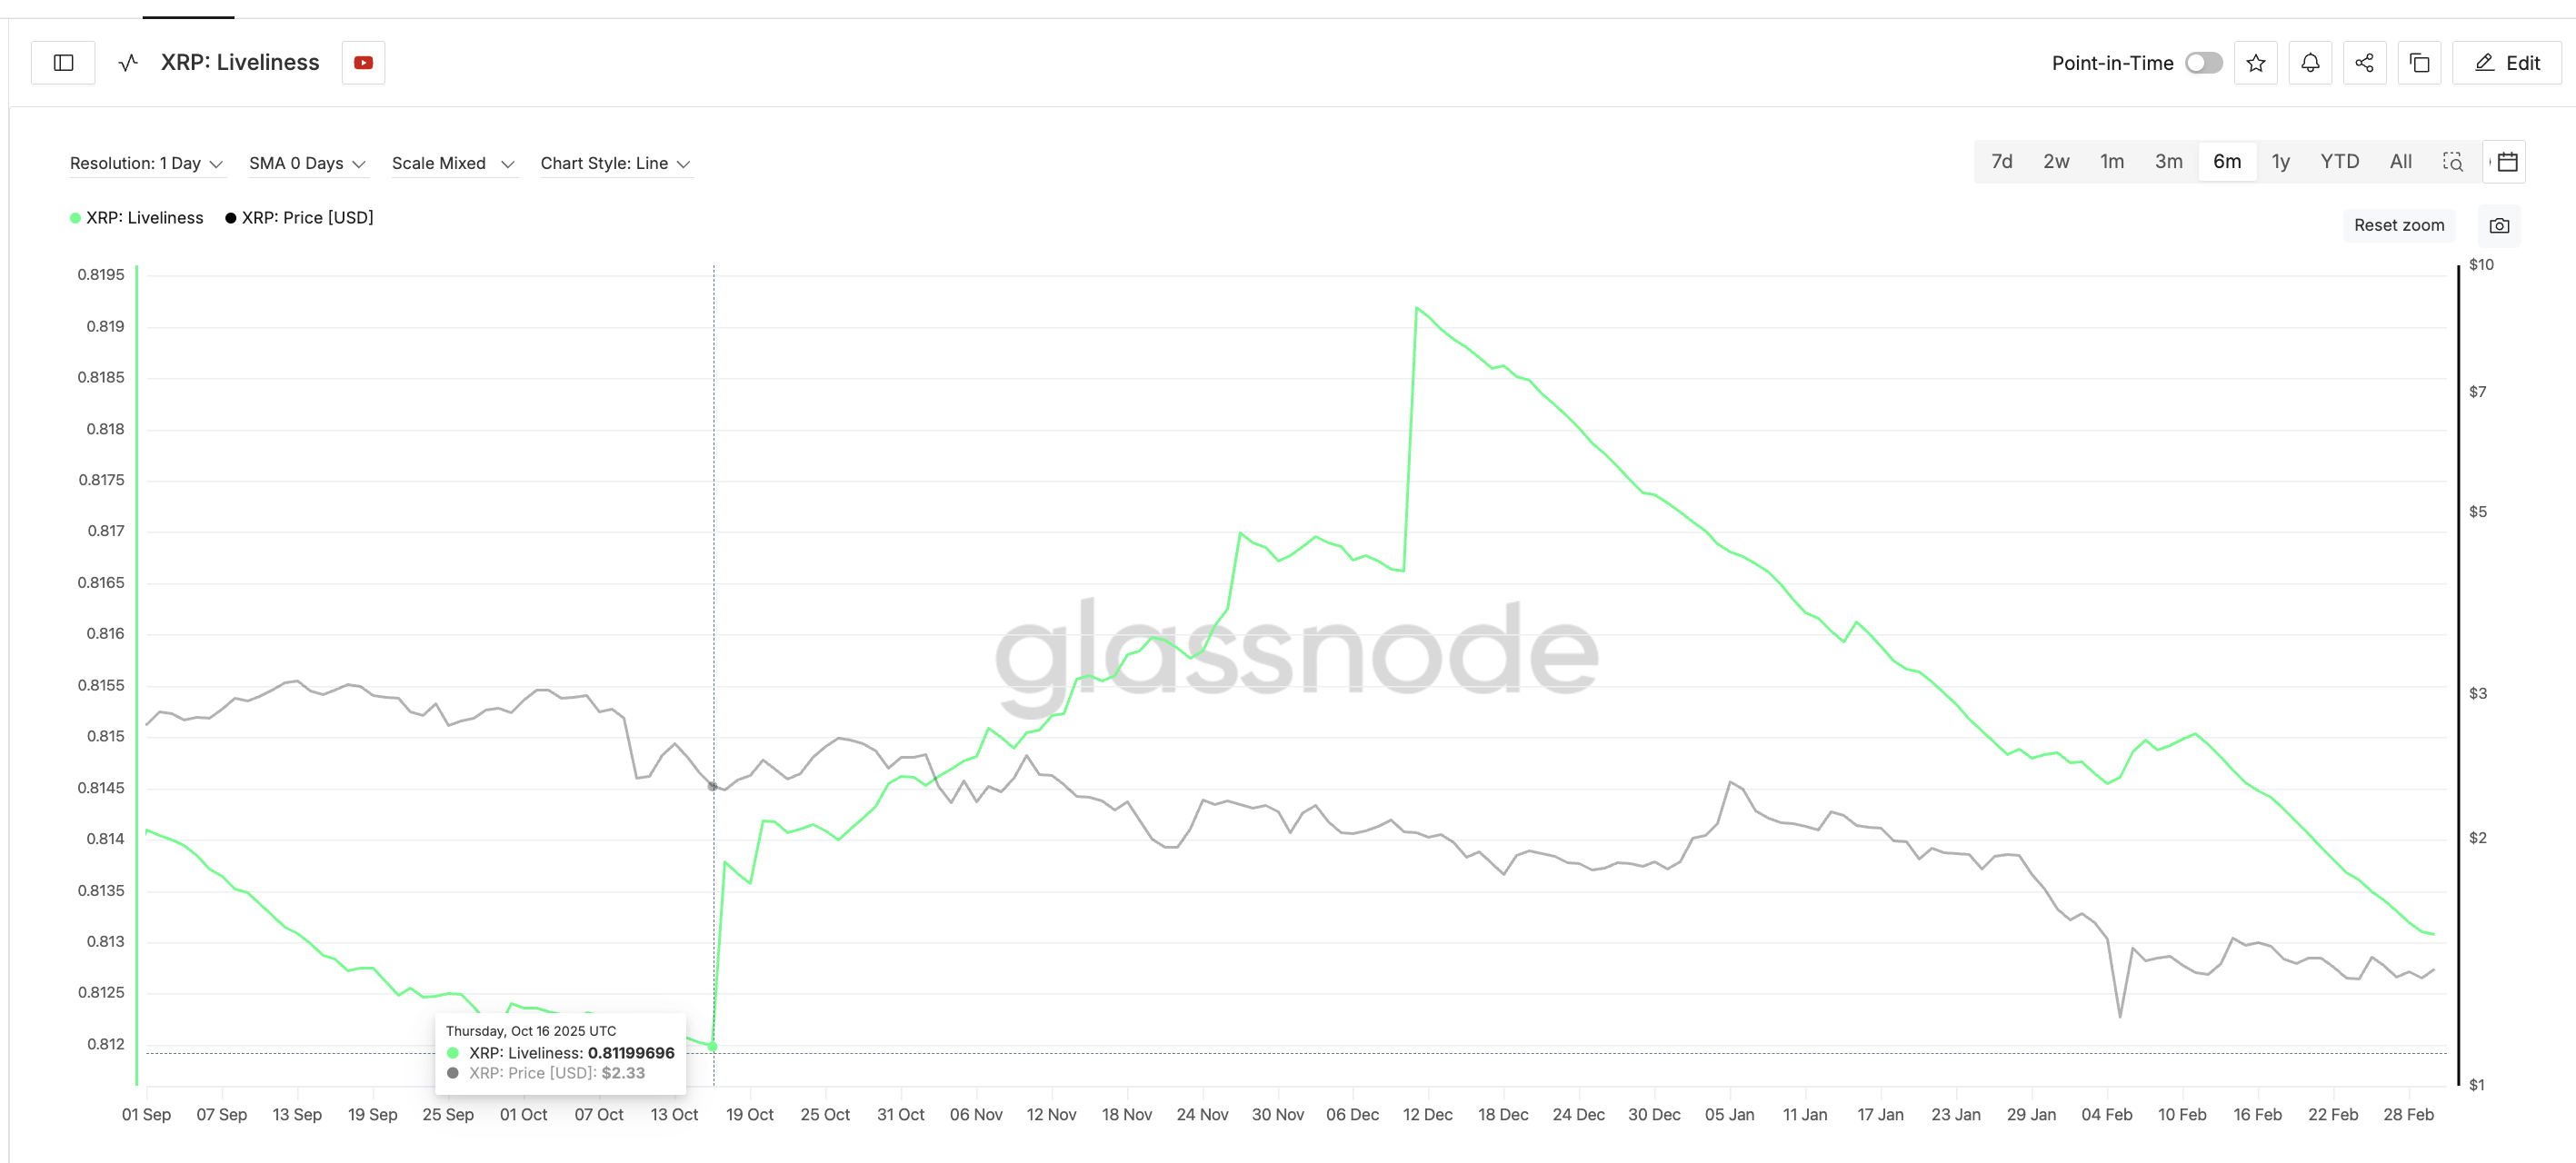
The same behavior appears to be forming again. That decline suggests long-term holders are tightening supply instead of selling into strength. ETF inflows returning while older coins remain dormant creates a constructive combination.
Institutional money is entering, long-term holders are not selling, and Active supply is shrinking. That alignment suggests conviction may be rebuilding beneath the surface. But conviction alone does not break resistance. Breaking resistance requires size. That brings the focus directly to whale positioning.
Whales Accumulate under the 2 Billion Sell Wall
Two major whale cohorts began accumulating on March 1. Addresses holding between 100 million and 1 billion XRP increased their balances from 7.39 billion to 8.59 billion XRP. And addresses holding between 10 million and 100 million XRP increased from 10.91 billion to 11.01 billion XRP. In total, they already added 1.30 billion XRP.
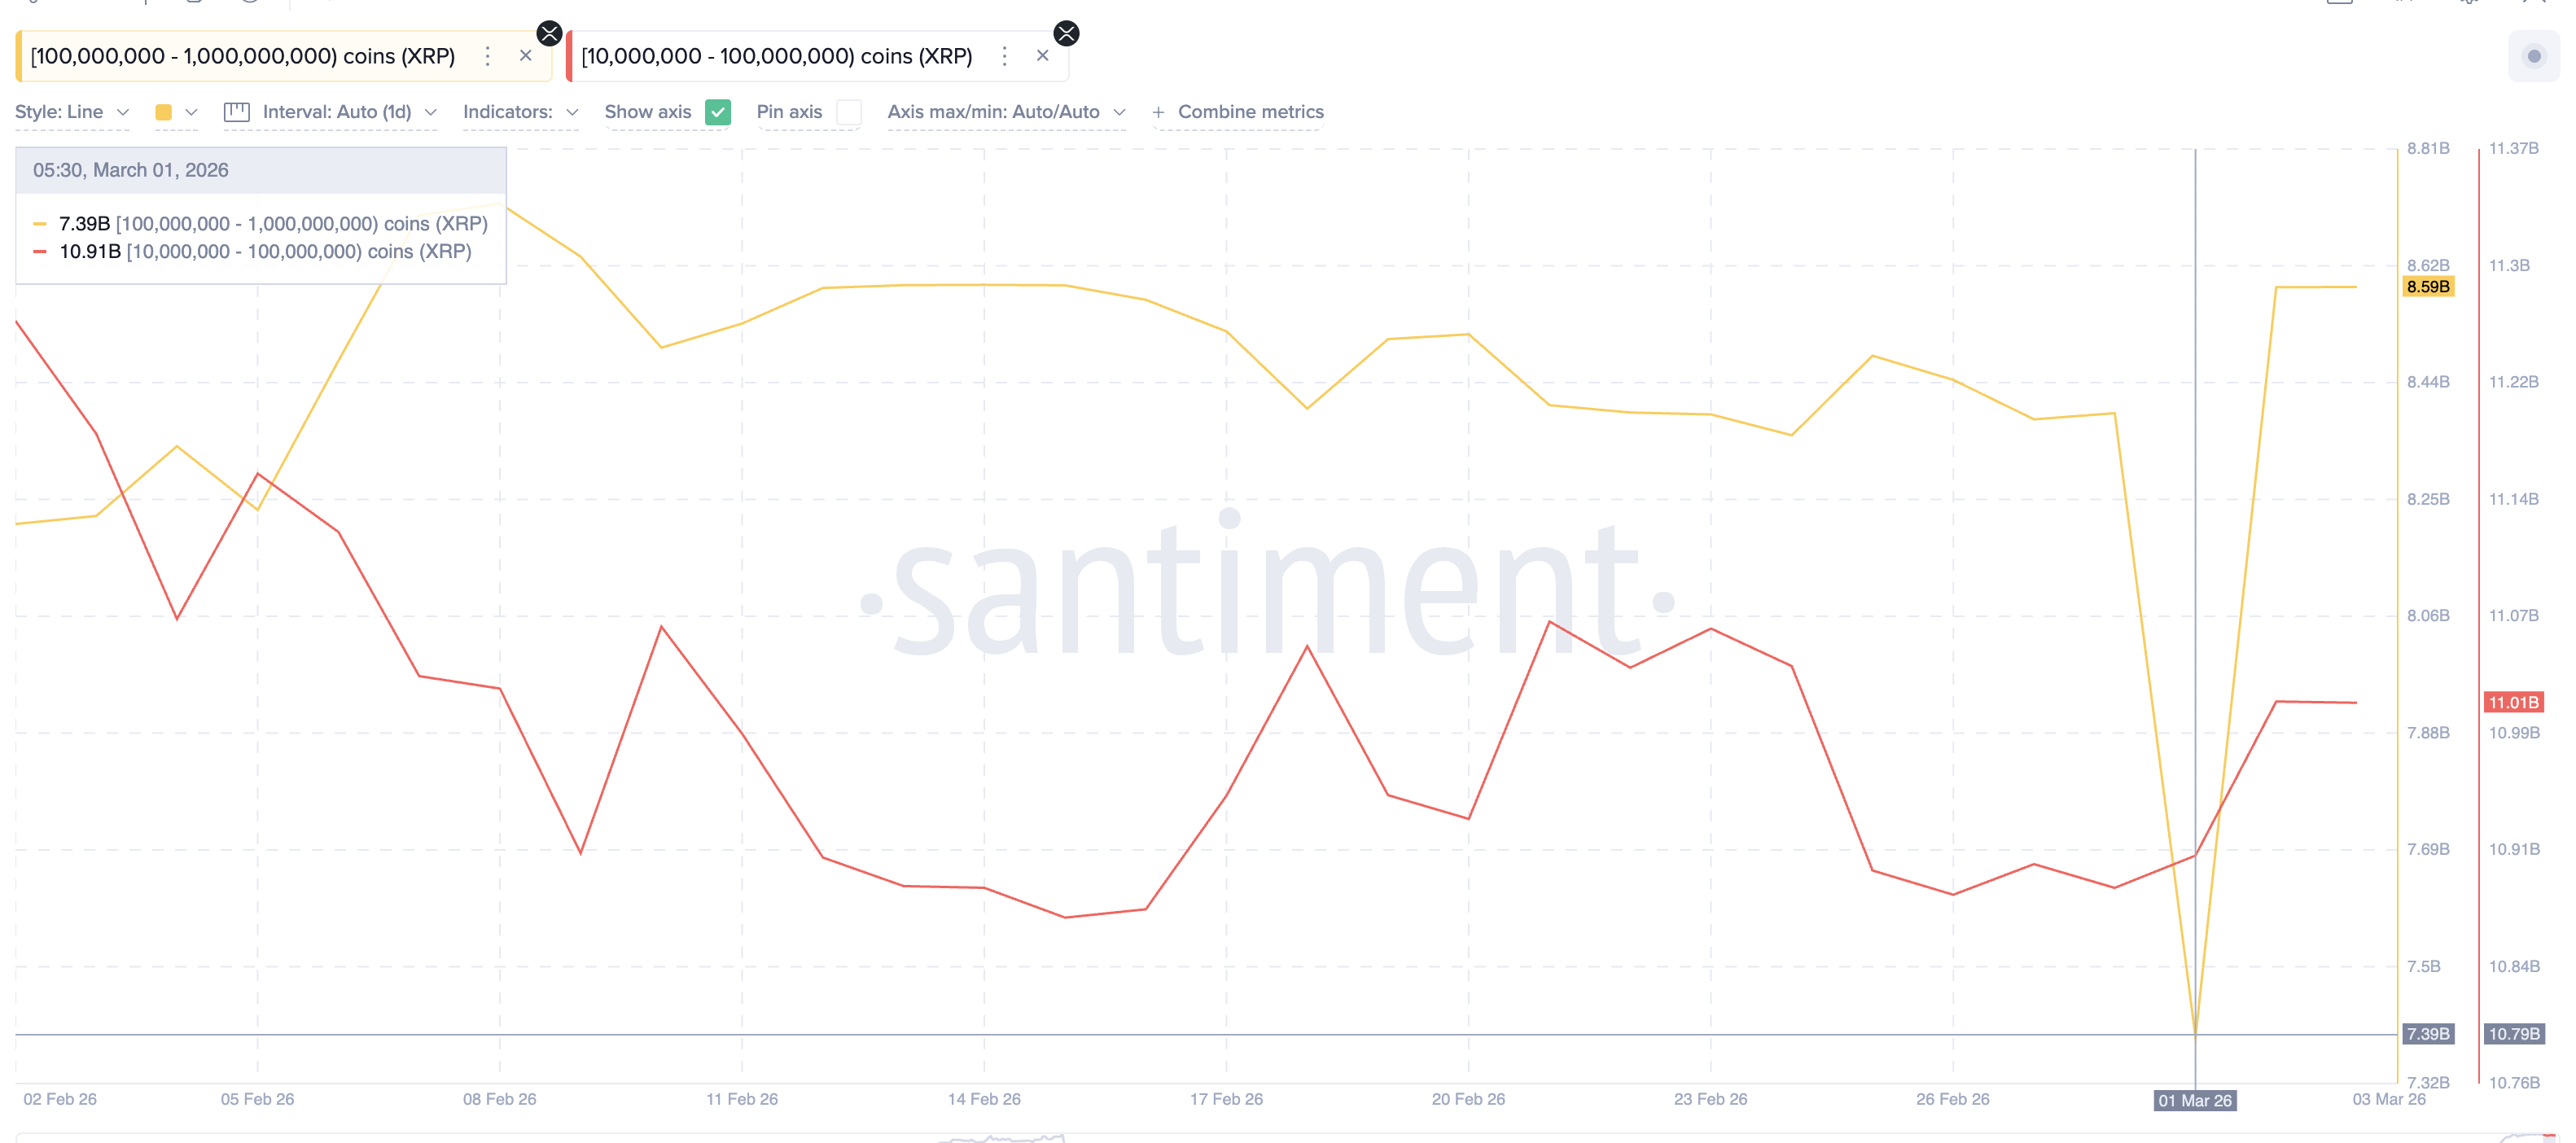
These are large entities capable of absorbing a heavy supply. Their accumulation is happening just beneath a major resistance cluster.
Cost basis distribution data shows approximately 2.00 billion XRP were accumulated between $1.58 and $1.60. Cost basis data reflects the average price at which holders acquired tokens. When price returns to these levels, many holders attempt to exit at breakeven if the conviction weakens. That creates selling pressure.
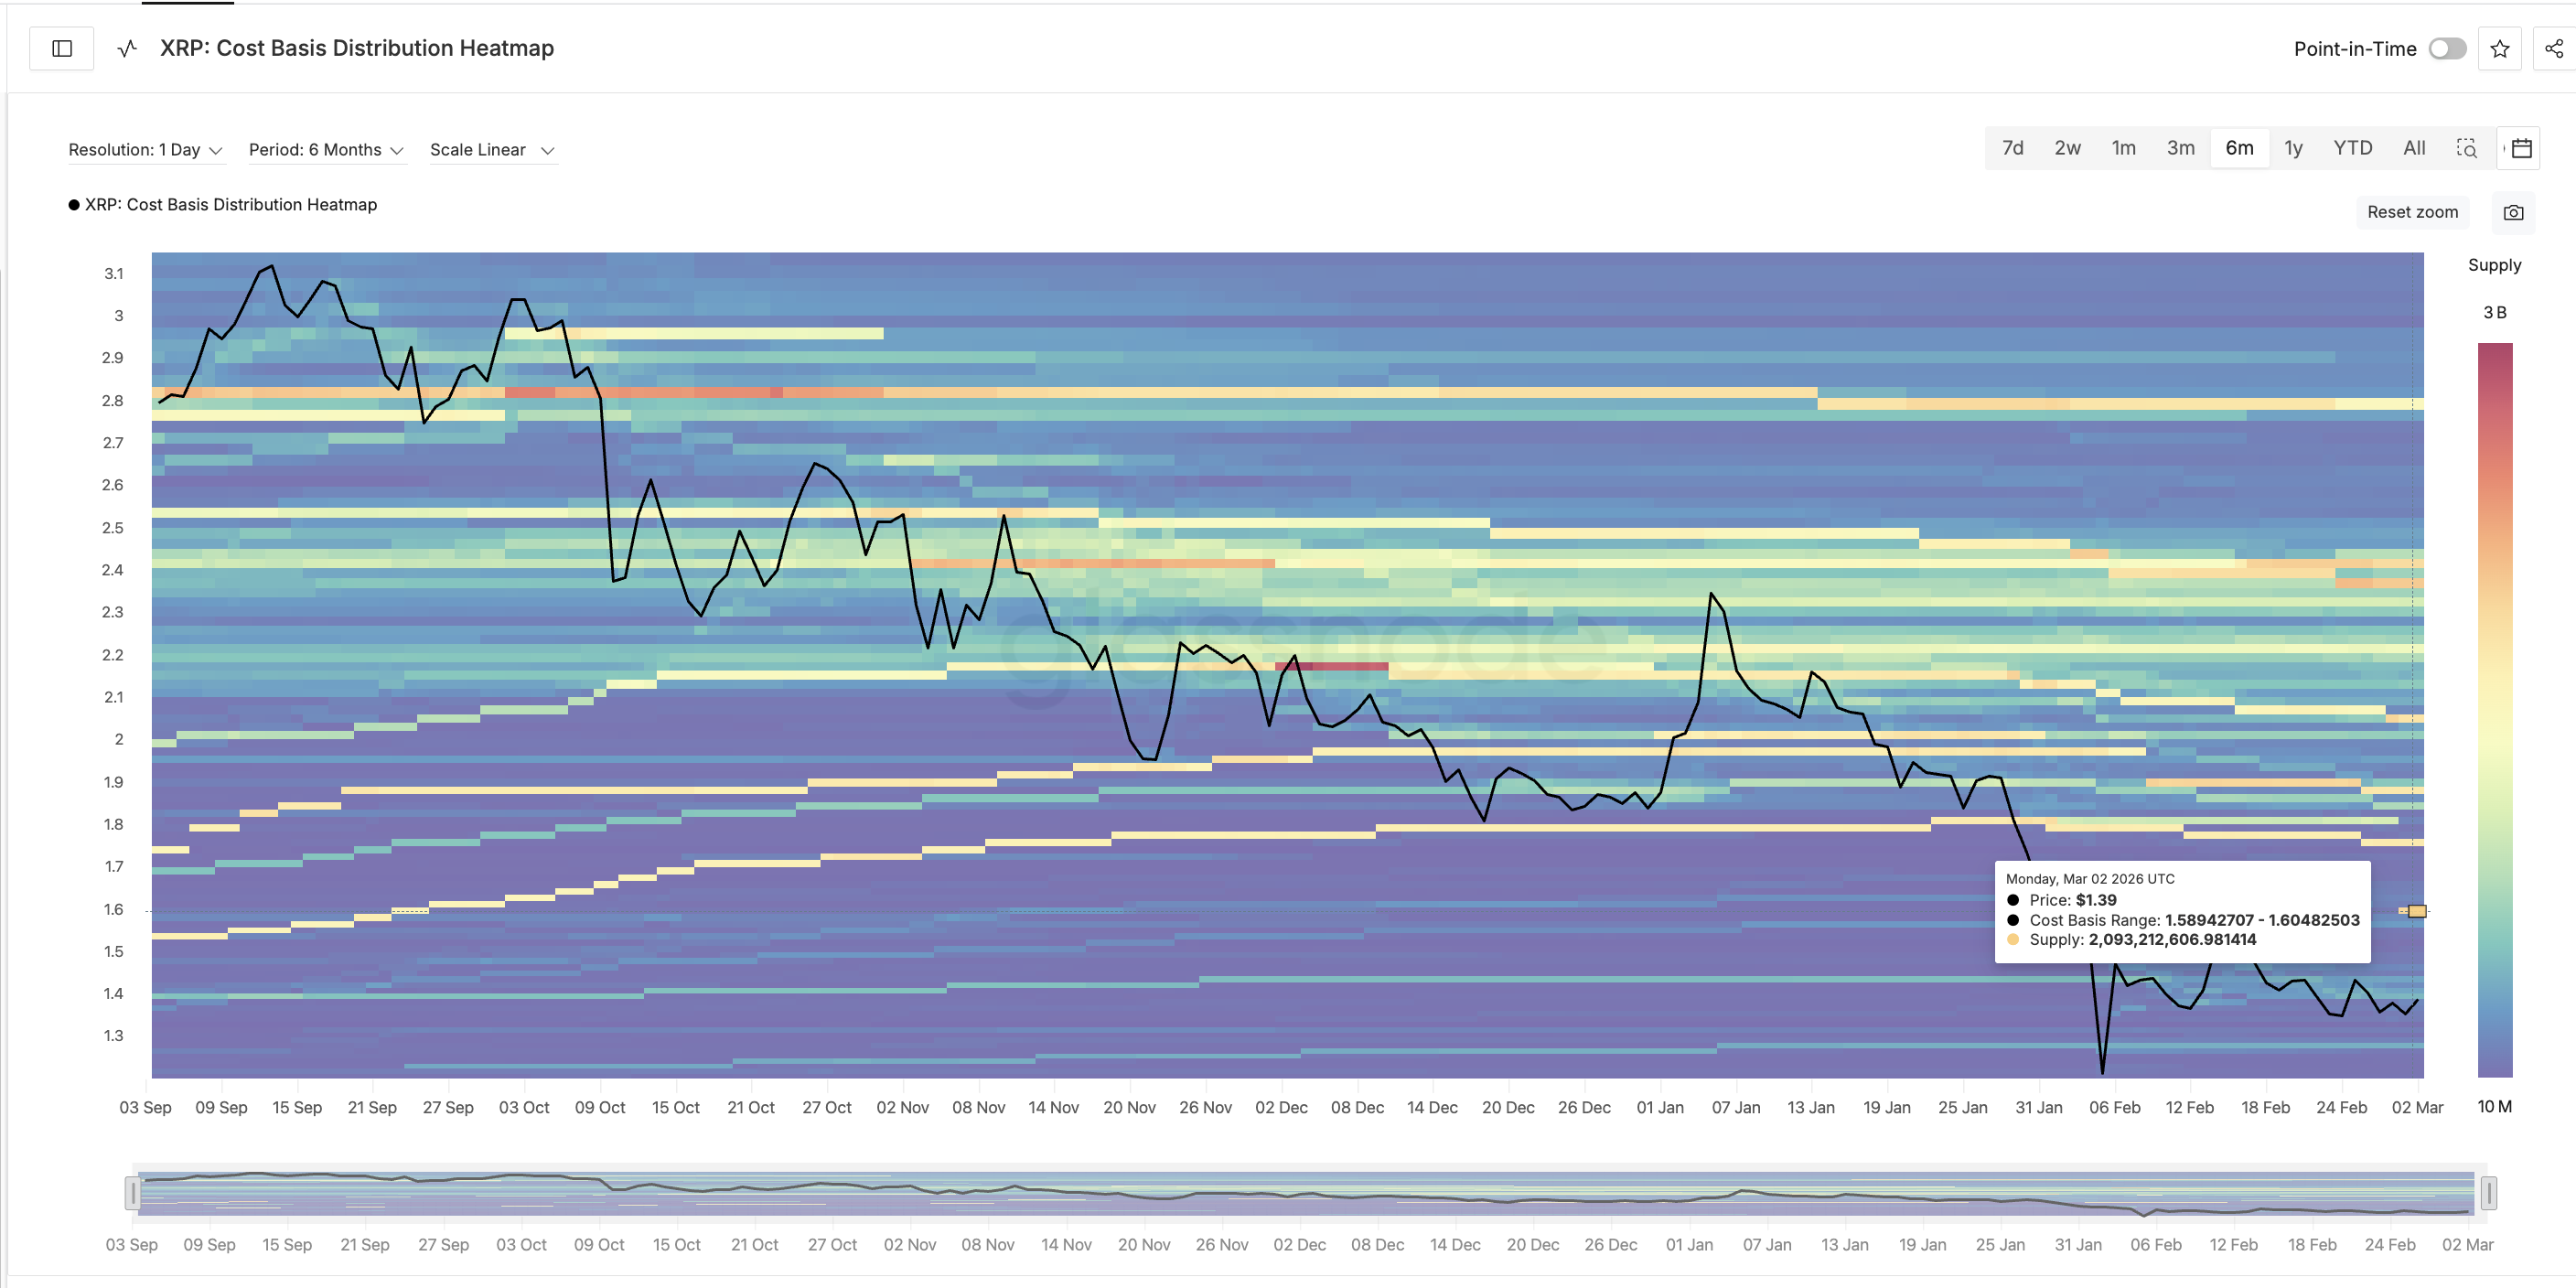
This explains February’s rejection near $1.67, close to the supply cluster zone. To push above $1.60, buyers must absorb more than 2 billion XRP in supply, which can only happen if whales join the party.
Now the structure becomes clear.
Institutional flows have started March strong, long-term holders are not selling, and whales are increasing exposure. Three forces are building beneath one wall.
One Level Decides Whether the XRP price Breaks Out or Stays Stuck
For immediate strength, the XRP price must first close above $1.43 and $1.48 to escape consolidation. The decisive level, however, remains $1.60-$1.61.
A daily close above $1.61 would signal that the 2 billion XRP supply cluster has most likely been absorbed, or the selling didn’t happen that aggressively. If that happens, XRP could extend toward $1.70 and potentially $2.16 in a stronger breakout scenario.
On the downside, $1.27 remains critical. Cost basis data shows roughly 443 million XRP accumulated between $1.27 and $1.28.
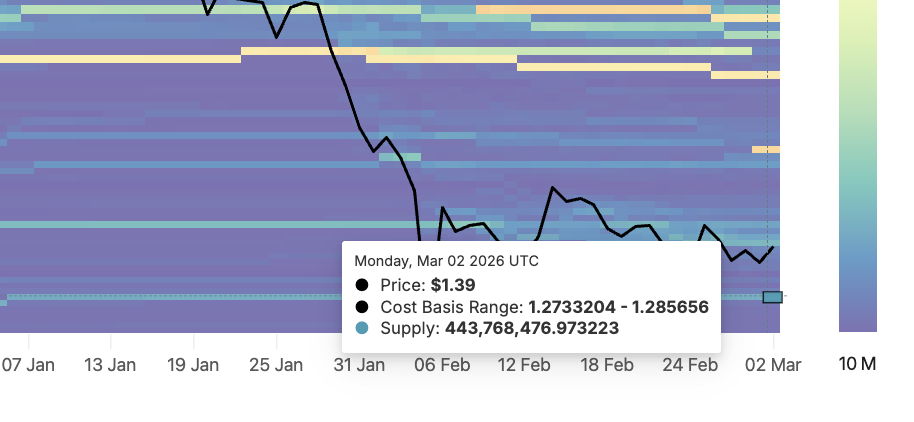
That cluster has repeatedly defended the price. If $1.27 breaks, XRP could revisit $1.11.
Until one of these levels gives way, the XRP price remains locked between compression and expansion. March has started strong. Now the breakout battle begins.