This Is the Worst Altcoin Cycle On Record – Here Is the Structural Force Behind It
The altseason never came. Months of waiting have produced nothing but lower prices, thinner liquidity, and a market that has run out of patience with its own promises.
Top analyst Darkfost has published findings that reframe the current altcoin environment not as a temporary setback but as something structurally worse: more than 40% of altcoins have either reached their all-time low or are approaching it with nothing visible standing between them and it.
That figure has now surpassed the peak reading from the previous bear market, which topped out at approximately 38%. This cycle — the one that was supposed to deliver the altseason — has produced more all-time low readings than the last one did at its worst.

The context Darkfost provides is unsparing. Geopolitical tensions continue to escalate, and the volatility that creates across financial markets is falling disproportionately on the most vulnerable assets. Altcoins sit at the bottom of that hierarchy. They absorb the fear first, recover last, and in this cycle, many have not recovered at all.
The altcoin market has not just underperformed. It has, for a significant portion of its assets, effectively reset to zero. That is not a correction. That is a reckoning.
The Macro Is Not the Whole Story. The Real Problem Has 47 Million Parts
Darkfost is direct about what most market commentary is missing. Yes, the macro environment is hostile. Geopolitical tension, risk-off positioning, and the worst 60-40 performance since 2022 are all real headwinds that no altcoin can outrun. But blaming the macro for the altcoin collapse is incomplete — and that incompleteness matters, because it leads investors toward the wrong diagnosis and therefore the wrong response.
The structural problem is this: there are now more than 47 million cryptocurrencies in existence. Twenty-two million on Solana alone. Over eighteen million on Base. Four million on BNB Smart Chain. The total pool of capital available to the crypto market has not grown anywhere near proportionally to the number of assets competing for it.
The result is liquidity dilution on a scale that has no historical precedent in this market — a spreading of finite capital across an effectively infinite number of tokens, each one drawing from the same shallow pool.
That is why altcoins are not just down. They are structurally fragile in a way they were not in previous cycles.
Darkfost’s forward observation is precise and deliberately restrained: extreme underperformance at this scale does create opportunity — but only for those willing to do the work of separating the resilient from the irrelevant. In a market of 47 million tokens, that distinction has never mattered more.
The Altcoin Market Has Given Back Everything. The Chart Makes That Impossible to Argue With
The total crypto market cap excluding the top 10 — the purest available measure of altcoin market health — currently stands at $173.12 billion, up 1.88% on the week. The weekly candle opened at $172.08 billion, reached $175.45 billion, and is holding modest gains. In the context of what the chart shows behind it, a 1.88% weekly gain is not a recovery. It is noise.

The macro picture is devastating. This index peaked near $480 billion in late 2024, marking the high point of the cycle that was supposed to deliver altseason. It has since collapsed 64% — erasing not just the 2024 gains but returning to levels last seen in mid-2023, before the bull market began in earnest. The entire altcoin bull run has been unwound.
The weekly moving average structure confirms the severity. Price has broken below all three MAs — the 50-week, 100-week, and 200-week — with all three now sloping downward in sequence. The 50-week MA crossed below the 100-week MA in a confirmed death cross. The 200-week MA near $190 billion, which provided definitive support at every major correction throughout the 2023-2024 cycle, has now been broken and is being tested from below.
$173 billion is not a floor. It is the level the market is currently defending after failing to hold $190 billion. The 2022 bear market low for this index sat near $80 billion. That reference is not a prediction. It is what the chart reveals when the current support gives way.
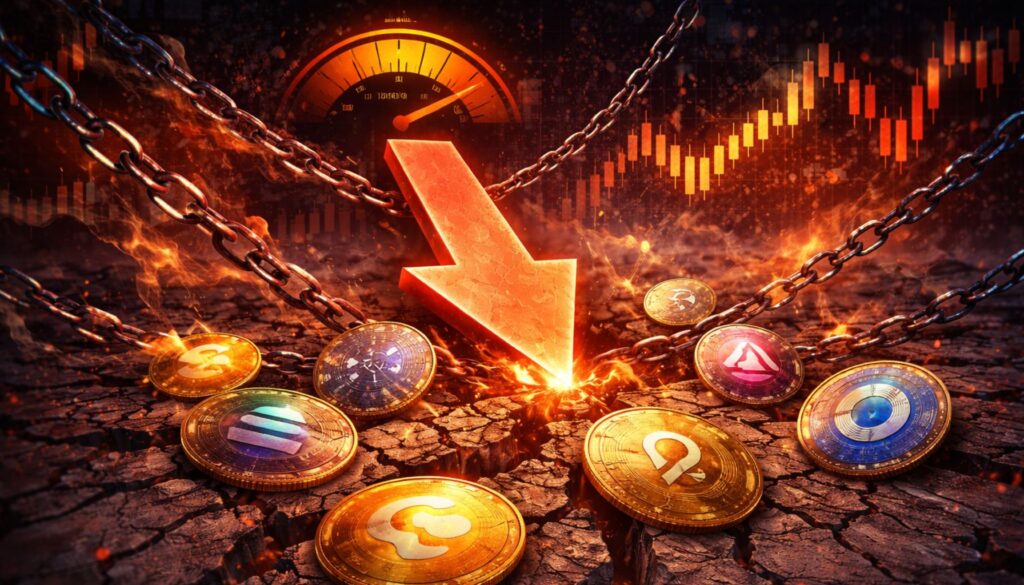
Featured image from ChatGPT, chart from TradingView.com

Editorial Process for bitcoinist is centered on delivering thoroughly researched, accurate, and unbiased content. We uphold strict sourcing standards, and each page undergoes diligent review by our team of top technology experts and seasoned editors. This process ensures the integrity, relevance, and value of our content for our readers.