Solana Price Breaks Key Support as Network Activity Slumps—Will Bears Trigger a Short Squeeze Next?
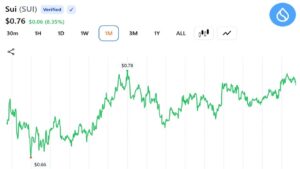
Solana (SOL) price is trading near $79.5 after failing to break out of the broad $76–$90 range that has contained price action for several months. The loss of momentum is occurring alongside signs of weakening participation across the Solana ecosystem and derivatives market. At the same time, liquidation data is creating a notable liquidity pocket above current prices. This leaves SOL at a critical juncture: continued weakness could reinforce the ongoing range-bound structure and trigger further downside.
Solana’s Network Activity Continues to Cool
The first warning sign comes from Solana’s on-chain activity. Data shows active users have steadily declined from nearly 3 million earlier this year to below 2 million in recent weeks. The latest reading of roughly 1.9 million users suggests network participation has continued to weaken despite multiple attempts by the price to recover.
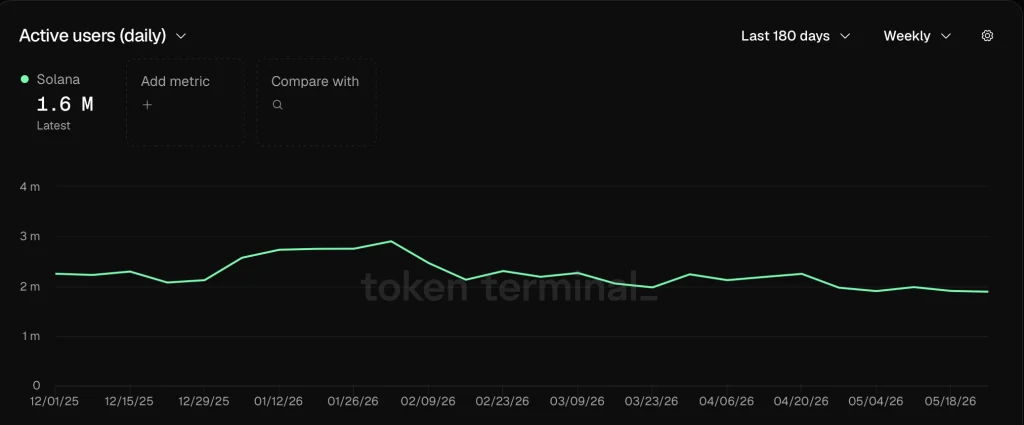
A decline in active users often signals reduced engagement across the ecosystem, which can eventually impact demand for the network’s native token. More importantly, the trend has remained intact for months, indicating the slowdown is not merely a short-term fluctuation. As user activity contracts, Solana loses one of the key fundamental drivers that previously supported its strong market performance.
DEX Volume and Open Interest Reflect Shrinking Participation
The weakness extends beyond user activity. According to DefiLlama data, Solana’s DEX volume has been in a sustained downtrend since peaking earlier this year, with daily trading activity falling dramatically from multi-billion-dollar levels. The persistent decline suggests liquidity and speculative demand across the ecosystem continue to fade.

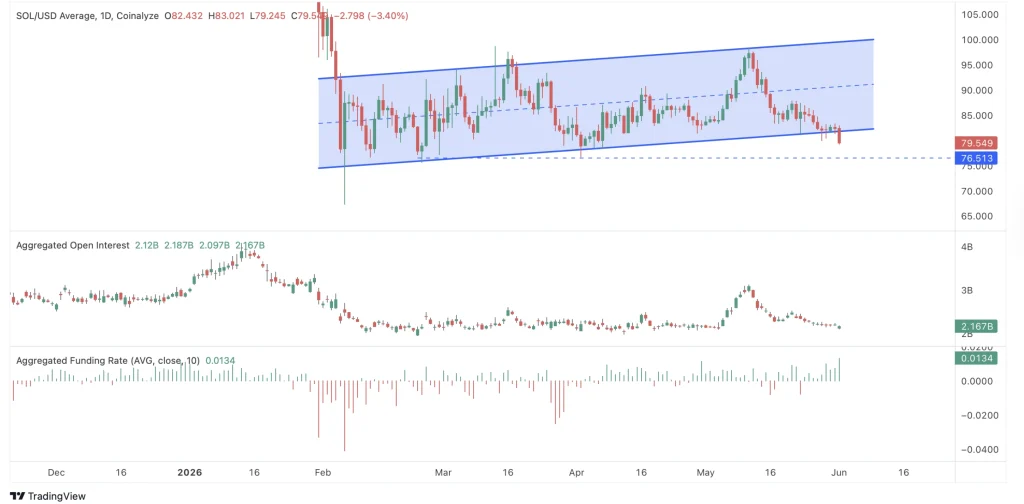
The derivatives market is displaying a similar pattern. Open Interest has dropped significantly from its recent highs near $3 billion and now hovers close to $2.1 billion. Falling Open Interest typically indicates traders are closing positions and reducing leverage exposure, reflecting declining conviction in the asset’s near-term direction.
What makes the current setup unusual is that funding rates remain positive despite the decline in participation. This indicates traders still maintain a bullish bias even as network activity, DEX volume, and derivatives exposure continue to weaken.
Bears May Be Setting Up Their Own Trap
While the broader data points toward weakness, the liquidation map highlights a potential risk for bearish traders. According to Coinglass data, the largest concentration of short liquidations is clustered between $83 and $87, creating a substantial liquidity pocket above the current price near $79.5.
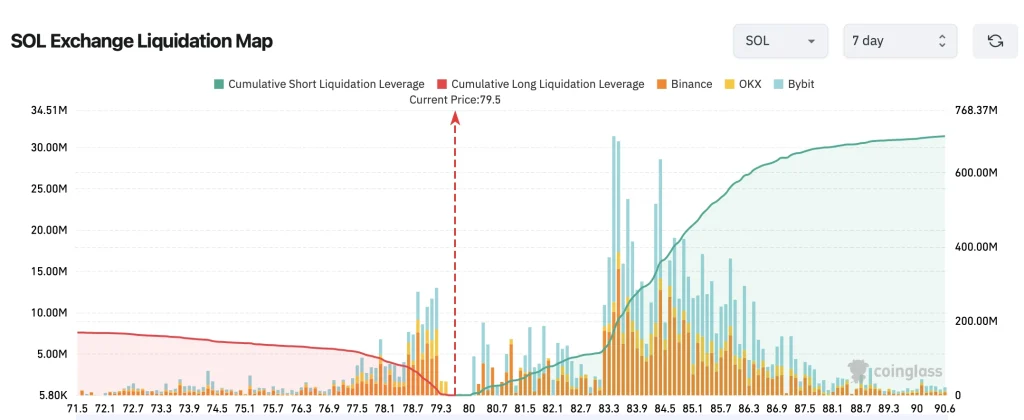
This means a relatively modest recovery could trigger a cascade of short liquidations, forcing bearish traders to buy back positions and accelerating upward momentum. Such events often create sharp rallies that appear disconnected from the underlying fundamentals.
As a result, the market is entering a critical phase. On one side, declining active users, falling DEX volume, and shrinking Open Interest continue to support the bearish case. On the other hand, the growing concentration of shorts increases the probability of a sudden relief rally if buyers reclaim nearby resistance levels.
Can SOL Defend the $76 Support Zone?
Solana’s declining user activity, falling DEX volume, and shrinking Open Interest suggest participation across the ecosystem continues to weaken, reinforcing the recent technical breakdown. However, the large concentration of short liquidations above current prices introduces the possibility of a sharp relief rally if bulls regain control. For now, the key levels remain $76 on the downside and the $83-$87 liquidity zone on the upside, with the next breakout likely determining whether SOL price extends its correction or stages an unexpected recovery.
Was this writing helpful?
Story Ends Here
Trust with CoinPedia:
CoinPedia has been delivering accurate and timely cryptocurrency and blockchain updates since 2017. All content is created by our expert panel of analysts and journalists, following strict Editorial Guidelines based on E-E-A-T (Experience, Expertise, Authoritativeness, Trustworthiness). Every article is fact-checked against reputable sources to ensure accuracy, transparency, and reliability. Our review policy guarantees unbiased evaluations when recommending exchanges, platforms, or tools. We strive to provide timely updates about everything crypto & blockchain, right from startups to industry majors.
Investment Disclaimer:
All opinions and insights shared represent the author’s own views on current market conditions. Please do your own research before making investment decisions. Neither the writer nor the publication assumes responsibility for your financial choices.
Sponsored and Advertisements:
Sponsored content and affiliate links may appear on our site. Advertisements are marked clearly, and our editorial content remains entirely independent from our ad partners.
Read the Next News