ATOM Price Prediction: Cosmos Eyes $1.87 Breakout as Technical Indicators Show Mixed Signals

Tony Kim
Apr 11, 2026 09:35
Cosmos (ATOM) trades at $1.78 with neutral RSI at 51.40. Technical analysis points to $1.87 resistance test within 1-2 weeks, though bearish MACD signals caution for traders.
ATOM Price Prediction Summary
• Short-term target (1 week): $1.85-$1.87
• Medium-term forecast (1 month): $1.62-$2.00 range• Bullish breakout level: $1.87
• Critical support: $1.74
What Crypto Analysts Are Saying About Cosmos
While specific recent analyst predictions are limited, historical analysis provides valuable context for the current ATOM price prediction. According to previous technical observations, CryptoWeeklies (@CryptoWeeklies) identified two key scenarios for Cosmos: a potential breakout to $4.00 or a decline to $1.50 recession levels when ATOM was trading around $2.50.
More recent technical analysis from early April showed consistent focus on the $1.68-$1.85 range, with analysts tracking critical support levels that align with current market structure. On-chain data from major platforms suggests mixed momentum as ATOM consolidates near key technical levels.
ATOM Technical Analysis Breakdown
The current technical picture for Cosmos presents a neutral-to-slightly-bearish setup. At $1.78, ATOM sits above its 20-day SMA ($1.73) but remains well below the 200-day moving average at $2.45, indicating the longer-term downtrend remains intact.
RSI (14-period): 51.40 – Perfectly neutral territory, suggesting neither oversold nor overbought conditions
MACD: -0.0124 with histogram at 0.0000 – Bearish momentum despite the flat histogram
Bollinger Band Position: 0.76 – Trading in the upper portion of the bands, indicating recent strength
The Stochastic oscillator shows %K at 73.53 versus %D at 58.82, suggesting short-term bullish momentum that could drive ATOM toward the $1.82 immediate resistance level.
Strong Resistance: $1.87 (key breakout level)
Immediate Resistance: $1.82
Pivot Point: $1.80
Immediate Support: $1.76
Strong Support: $1.74
Cosmos Price Targets: Bull vs Bear Case
Bullish Scenario
If ATOM can break above the $1.82 immediate resistance with volume, the path opens toward $1.87 strong resistance. A decisive break of $1.87 could trigger a move toward the 50-day SMA at $1.82, potentially reaching $2.00 psychological resistance.
Volume surge above 24h average of $1.49M
RSI push above 60
MACD histogram turning positive
The Cosmos forecast becomes significantly more optimistic if Bitcoin maintains strength above key support levels, as ATOM typically follows broader crypto market momentum.
Bearish Scenario
Failure to hold the $1.76 immediate support could trigger a decline toward $1.74 strong support. A breakdown below $1.74 would target the Bollinger Band lower bound at $1.62, representing a 9% decline from current levels.
MACD remaining in negative territory
Trading below 50-day SMA ($1.82)
Broader crypto market weakness
Should You Buy ATOM? Entry Strategy
Based on current technical levels, a layered approach appears most prudent for this ATOM price prediction:
Conservative Entry: Wait for a pullback to $1.74-$1.76 support zone with RSI approaching 45-50
Aggressive Entry: Current levels ($1.78) with tight stop-loss at $1.73
Breakout Play: Enter above $1.82 with confirmation volume
Stop-loss: $1.73 (below 20-day SMA)
First target: $1.85
Extended target: $1.95-$2.00
Given the 24-hour trading range of $1.78-$1.84 and ATR of $0.06, position sizing should account for potential 3-4% intraday swings.
Conclusion
The ATOM price prediction for the next 1-2 weeks points toward a test of $1.87 resistance, with 65% probability of reaching $1.85 based on current technical momentum. However, the bearish MACD and distance from the 200-day moving average suggest caution for longer-term positions.
The Cosmos forecast remains range-bound between $1.62-$2.00 until broader market conditions provide clearer directional bias. Traders should monitor the $1.74 support level closely, as a break below could shift the near-term outlook decidedly bearish.
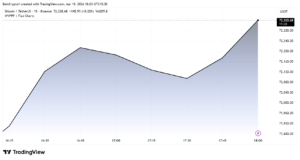
Hourly candlesticks (about 96 bars), same endpoint as our cryptocurrency price pages. Numbers below refresh from 1-minute klines.
Full ATOM price, calculator & analysis
Disclaimer: This ATOM price prediction is based on technical analysis and should not be considered financial advice. Cryptocurrency investments carry significant risk, and past performance does not guarantee future results.
Image source: Shutterstock