Bitcoin Price Analysis Flags the $63,000 Zone — Here Is Why

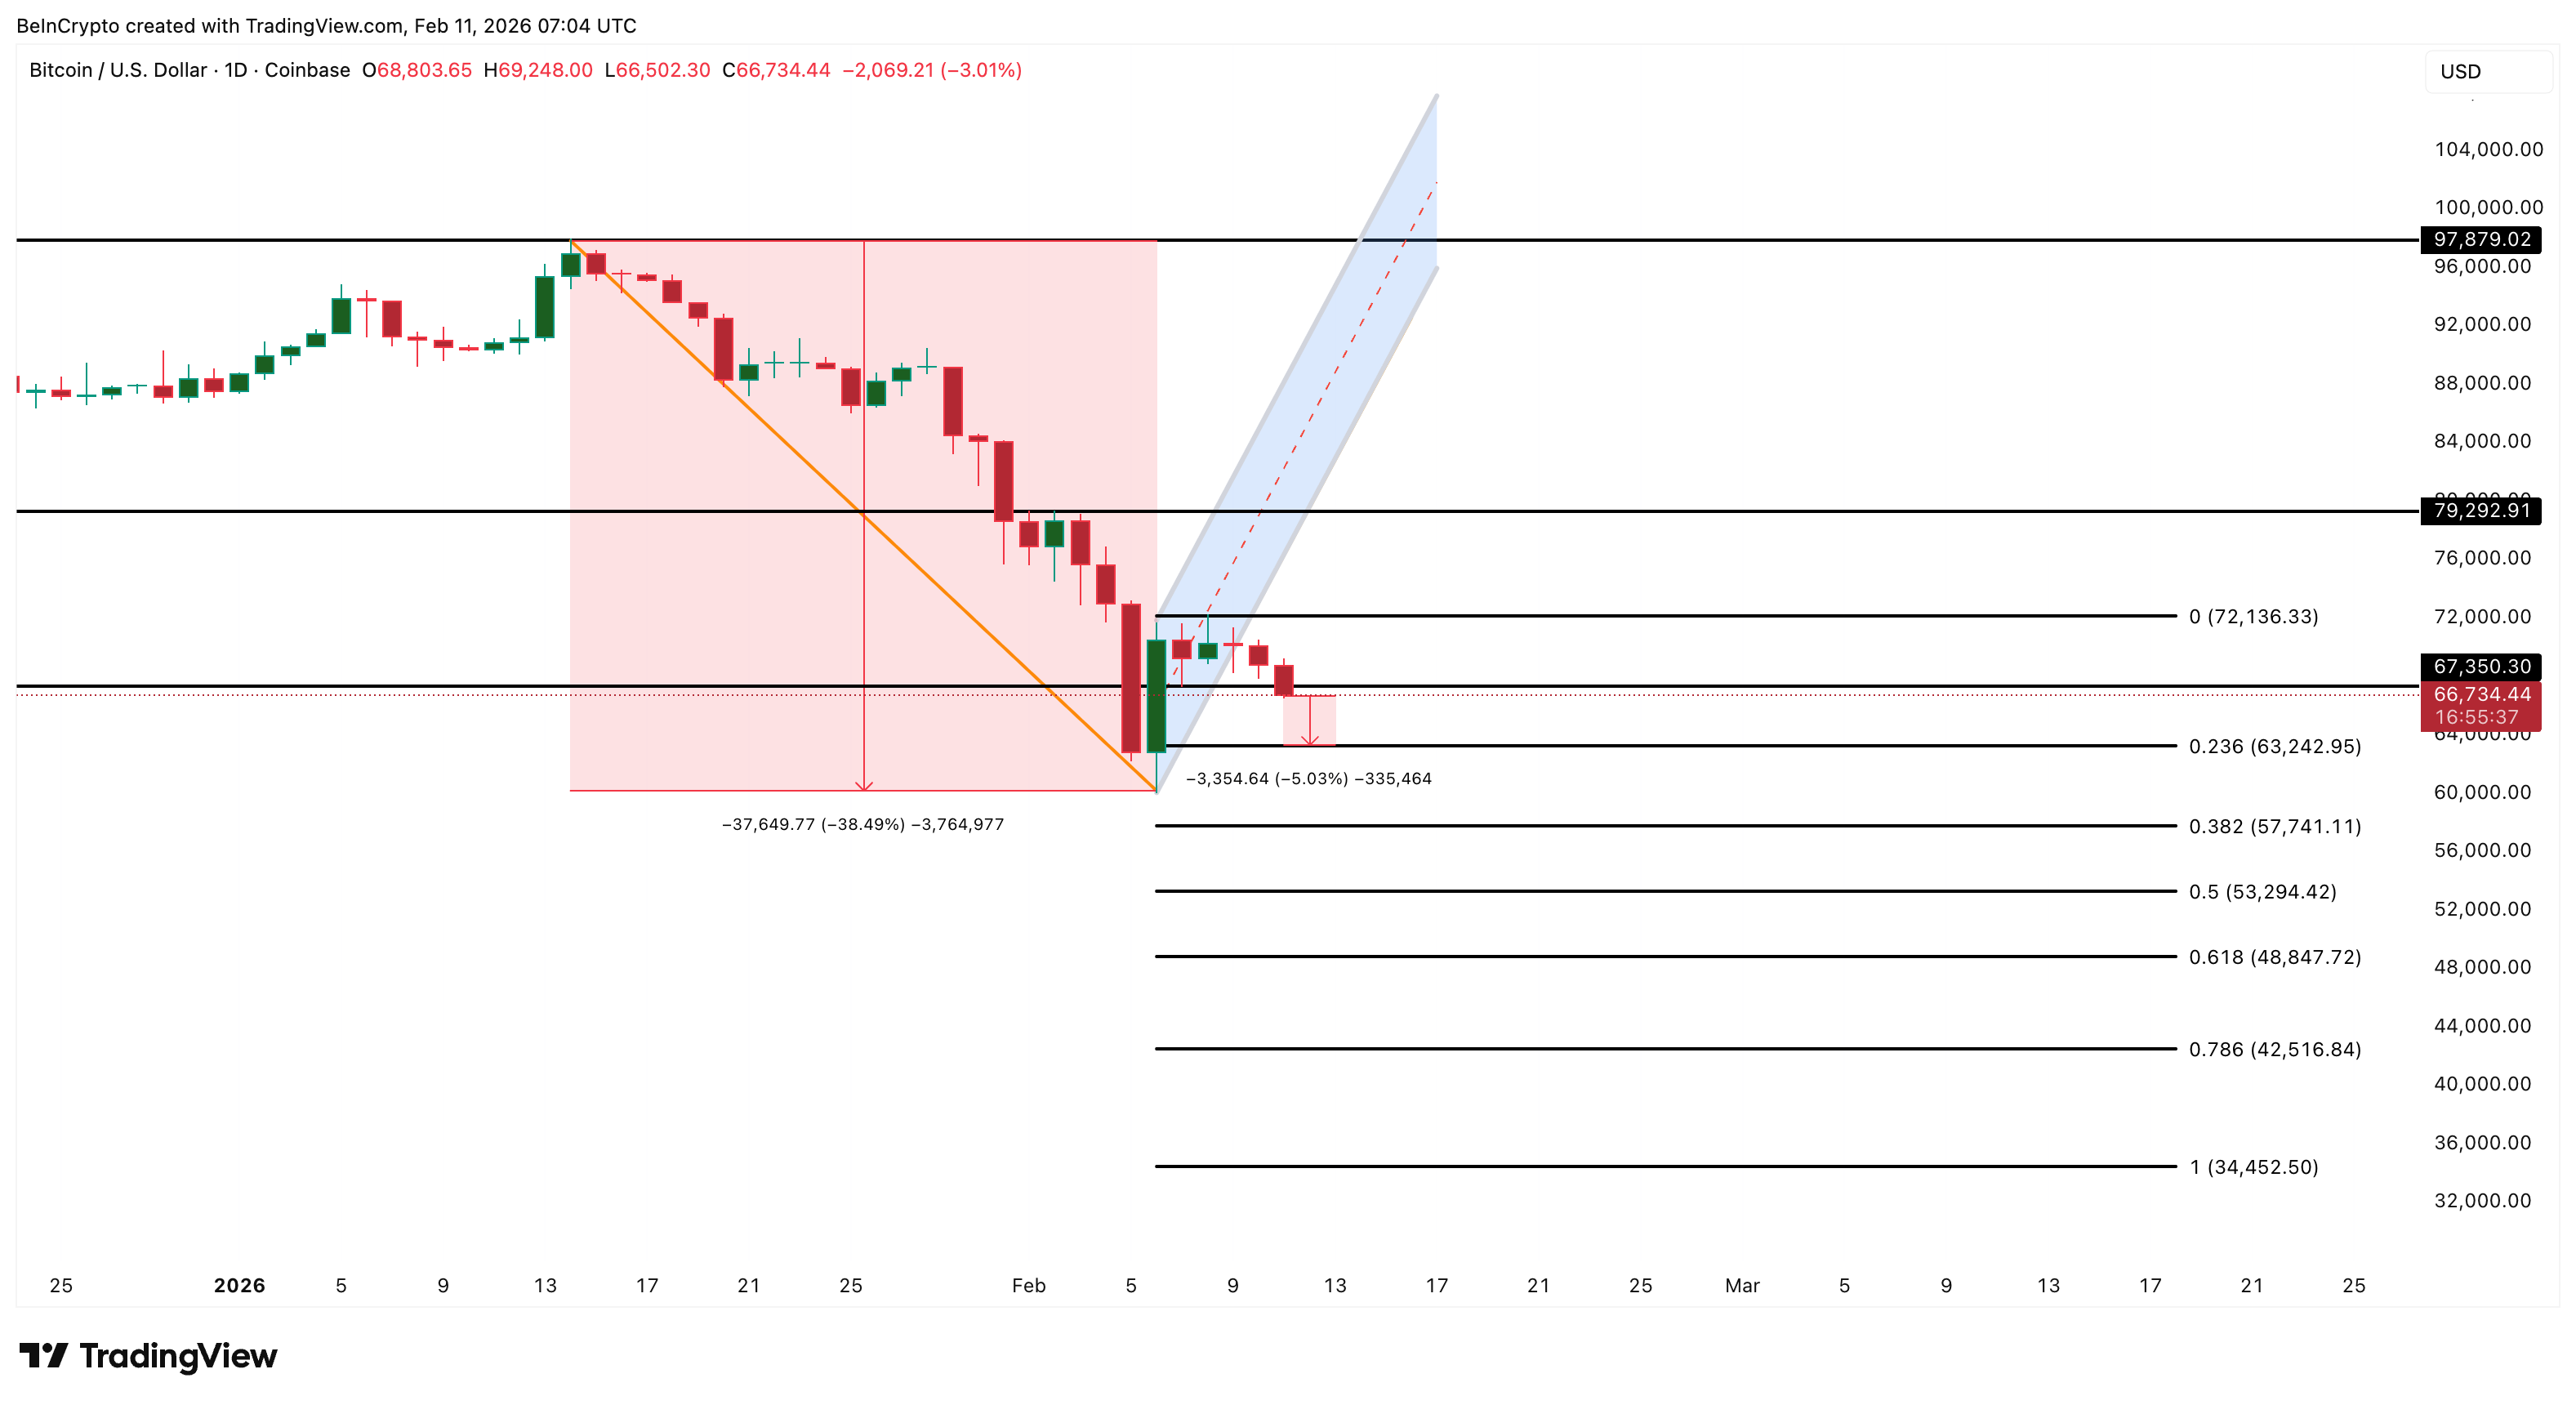
The Bitcoin price is sliding again after a failed rebound following February 6. The BTC price is down nearly 3% in 24 hours and about 38% since mid-January. After bouncing from $60,100 to $72,100, buyers lost control, and the rebound faded.
Technical signals had warned early, and on-chain data now confirms growing selling pressure. The key question is simple: can $63,000 stop the next leg lower, or is a deeper reset coming?
Sponsored
Sponsored
Bear Flag Failure and RSI Divergence Confirm Downtrend
After the January sell-off, Bitcoin formed a bear flag on the daily chart. A bear flag happens when the price drops sharply and then rebounds weakly inside a narrow range. It usually signals continuation rather than recovery. From mid-January, Bitcoin fell about 38% to near $60,130 and then rebounded toward $72,200 in early February. That rebound formed the flag.
On February 10, the price broke below the lower boundary of this structure, confirming the bear flag failure. Momentum indicators had already warned about this move. The Relative Strength Index, or RSI, measures buying and selling strength. When RSI rises while price weakens, it signals hidden bearish pressure.
Between November 24 and February 8, Bitcoin made lower highs while RSI made slightly higher highs.
Want more token insights like this? Sign up for Editor Harsh Notariya’s Daily Crypto Newsletter here.
This created a hidden bearish divergence, a post-rebound pullback risk. Once the rebound lost strength, sellers took control again. The pullback came as RSI flashed divergence, which eventually led to the pattern breakdown, following clear technical exhaustion. But charts alone do not explain everything, and on-chain behavior shows who is driving this move.
Sponsored
Sponsored
Holders Are Selling Again as Conviction Weakens
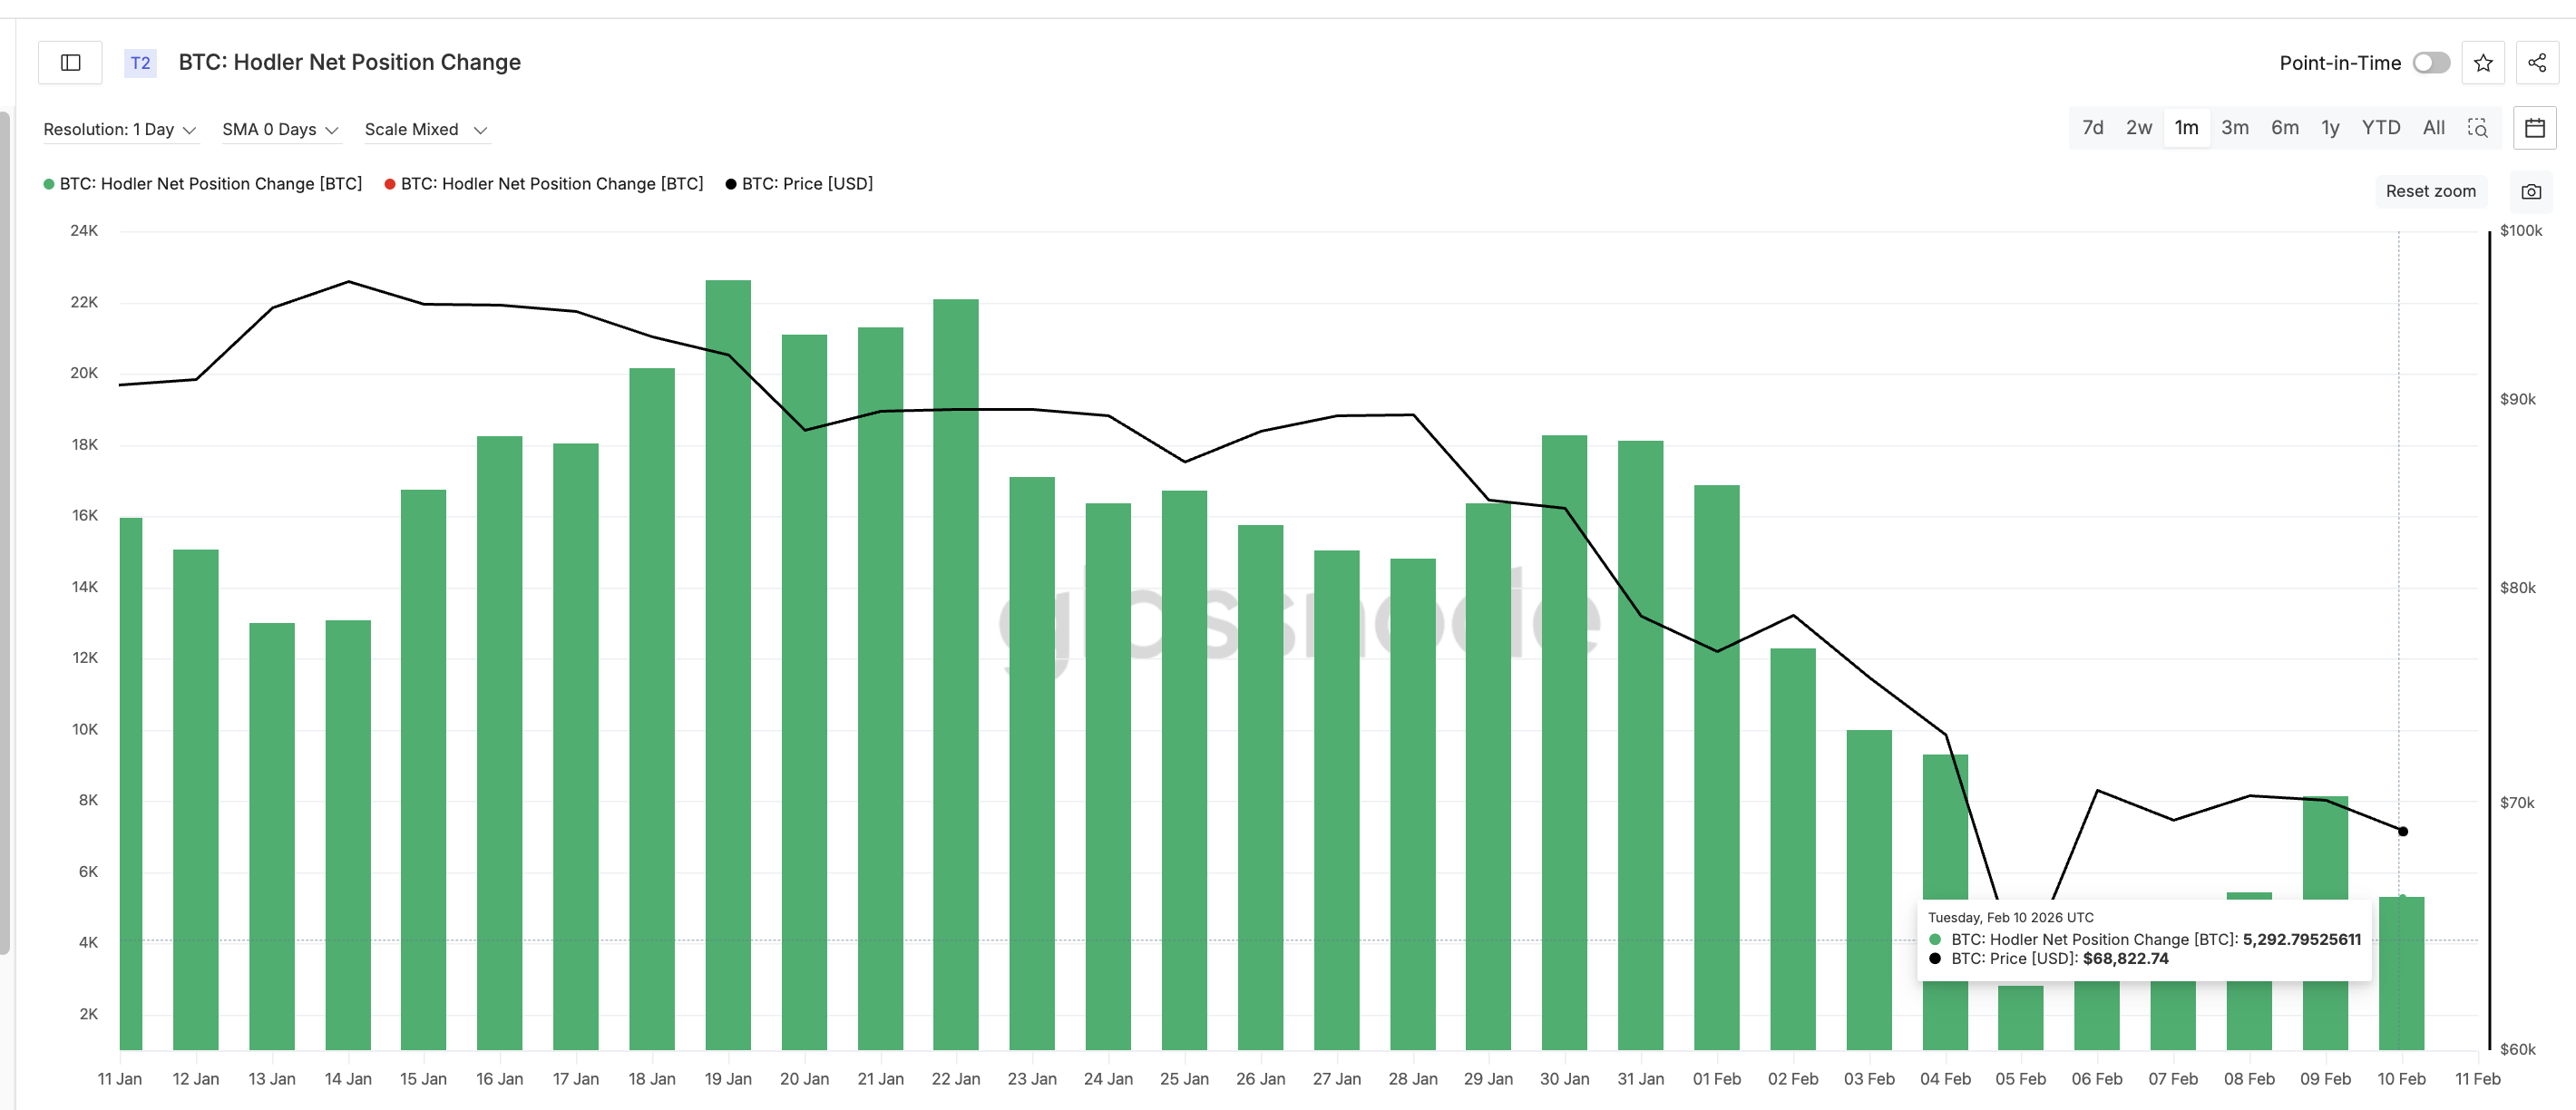
On-chain data shows that long-term investors are reducing exposure. One key metric is Hodler Net Position Change, which tracks wallets holding coins for more than 155 days. It shows whether medium- to long-term holders are buying or selling over 30 days.
On February 9, this metric stood near +8,142 BTC. By February 10, it had fallen to about +5,292 BTC. This sharp, 35% drop in accumulation means these holders are slowing their buying and losing conviction.
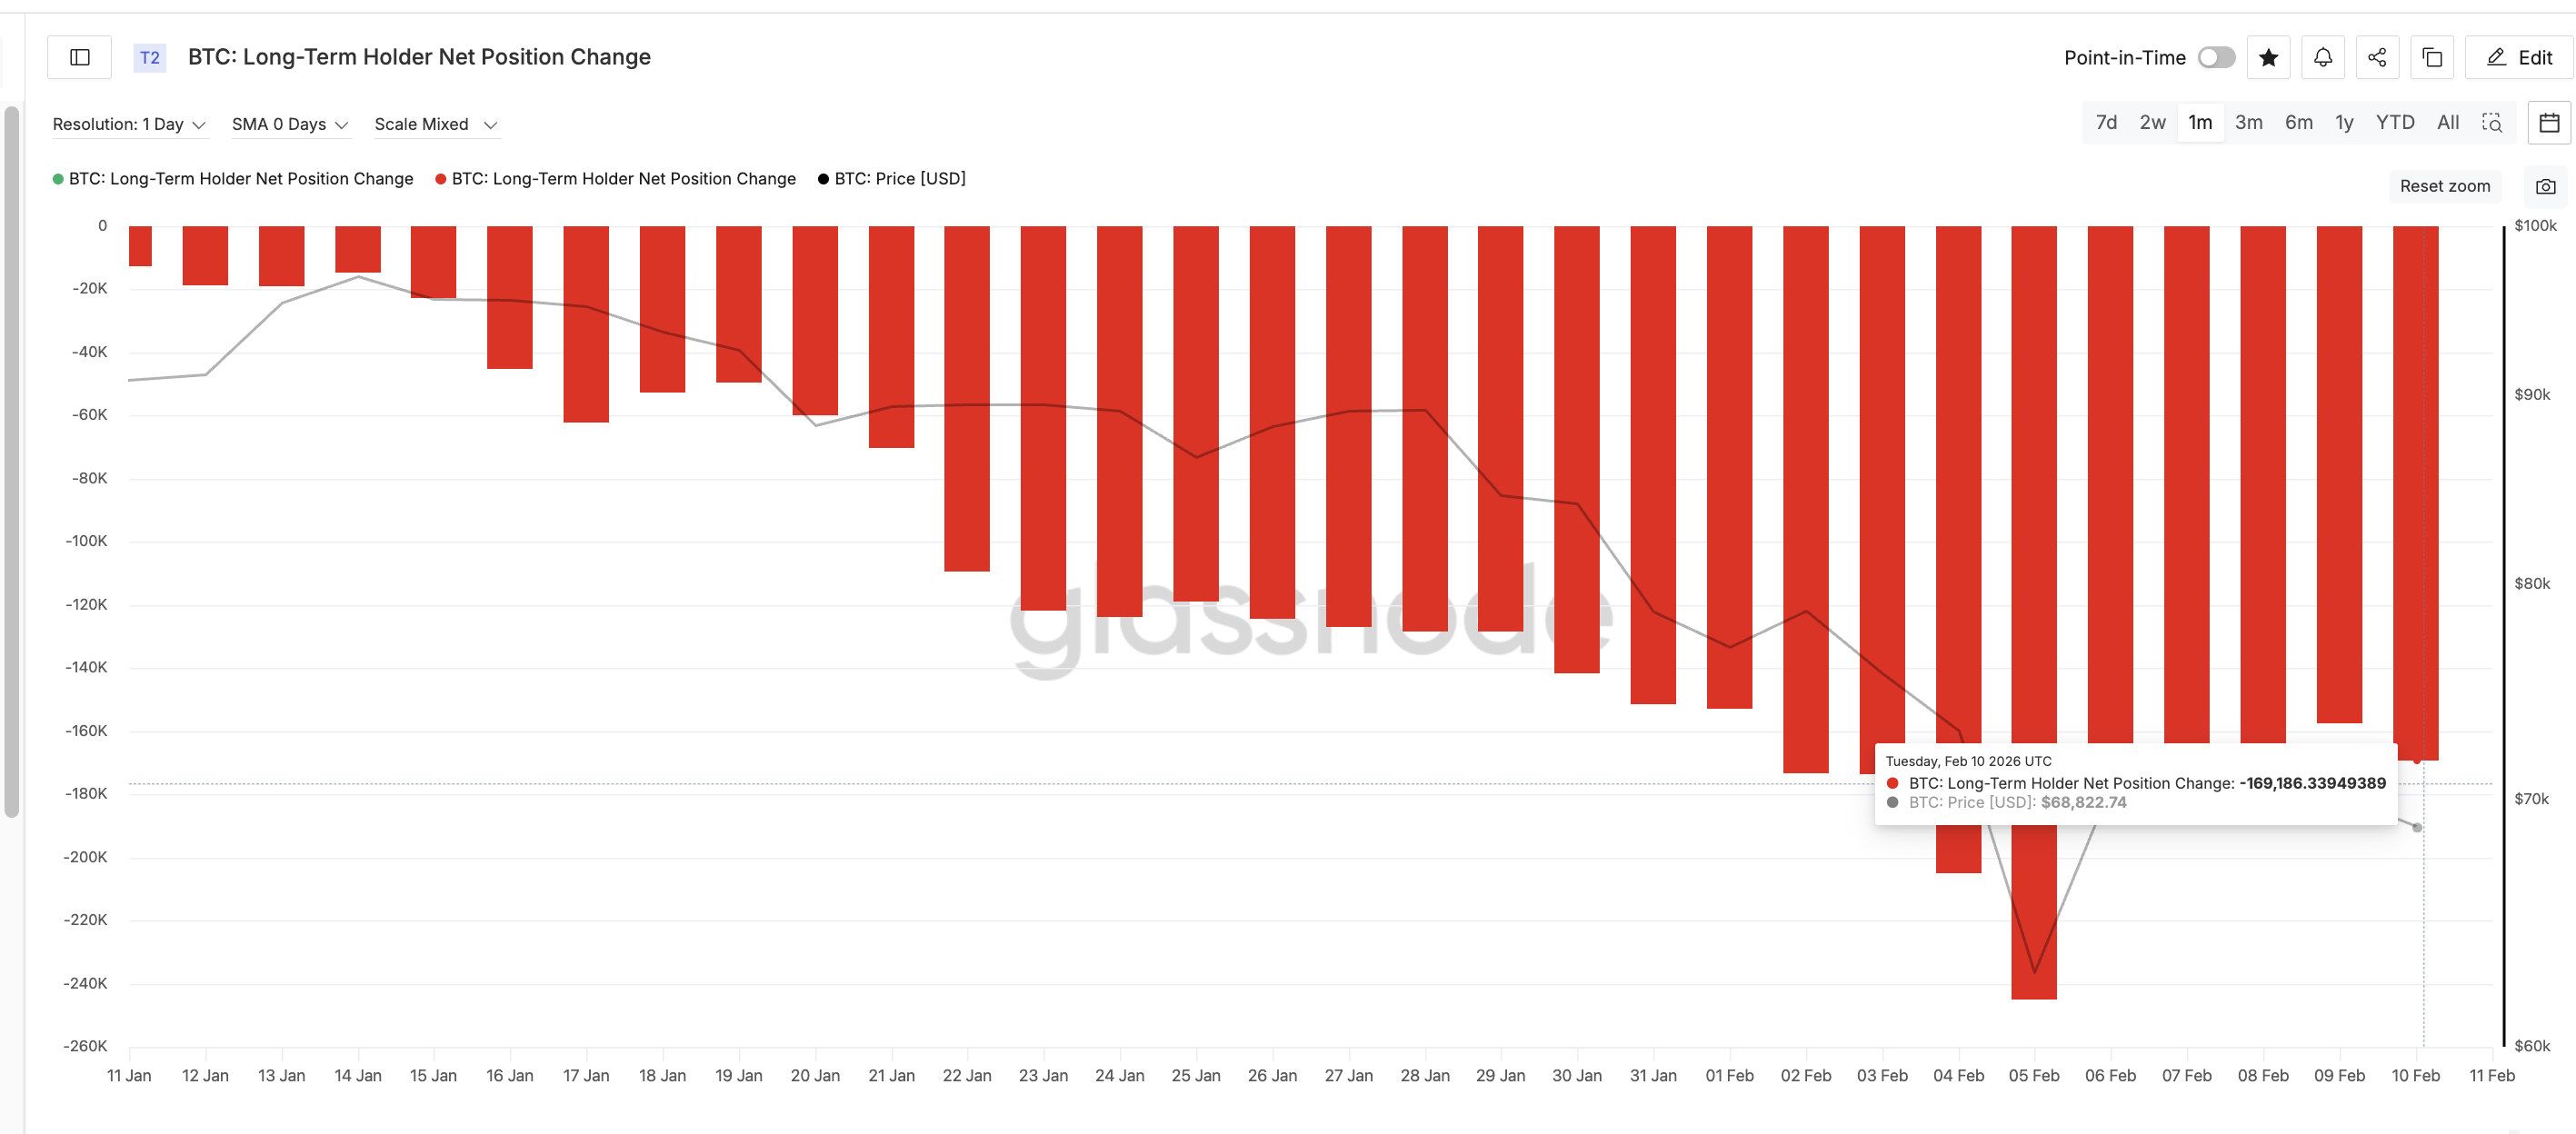
Even selling pressure is quietly building beneath the surface. Another important metric is Long-Term Holder Net Position Change, which focuses on very long-term wallets that typically hold for more than one year. On February 9, it stood near −157,757 BTC (negative means continued selling). By February 10, it widened to about −169,186 BTC, a 7% rise. This shows that older holders are selling faster.
Sponsored
Sponsored
When both medium-term buy and very long-term investors sell, the downside risk increases. HODL Waves confirm this shift. This metric shows how supply is distributed by holding time. The 24-hour cohort represents very short-term traders who tend to react emotionally to price moves.
Between February 7 and February 10, their share rose from about 0.72% to 1.02%. That is a major jump in fast-moving supply. These holders often sell quickly during drops, making support fragile.
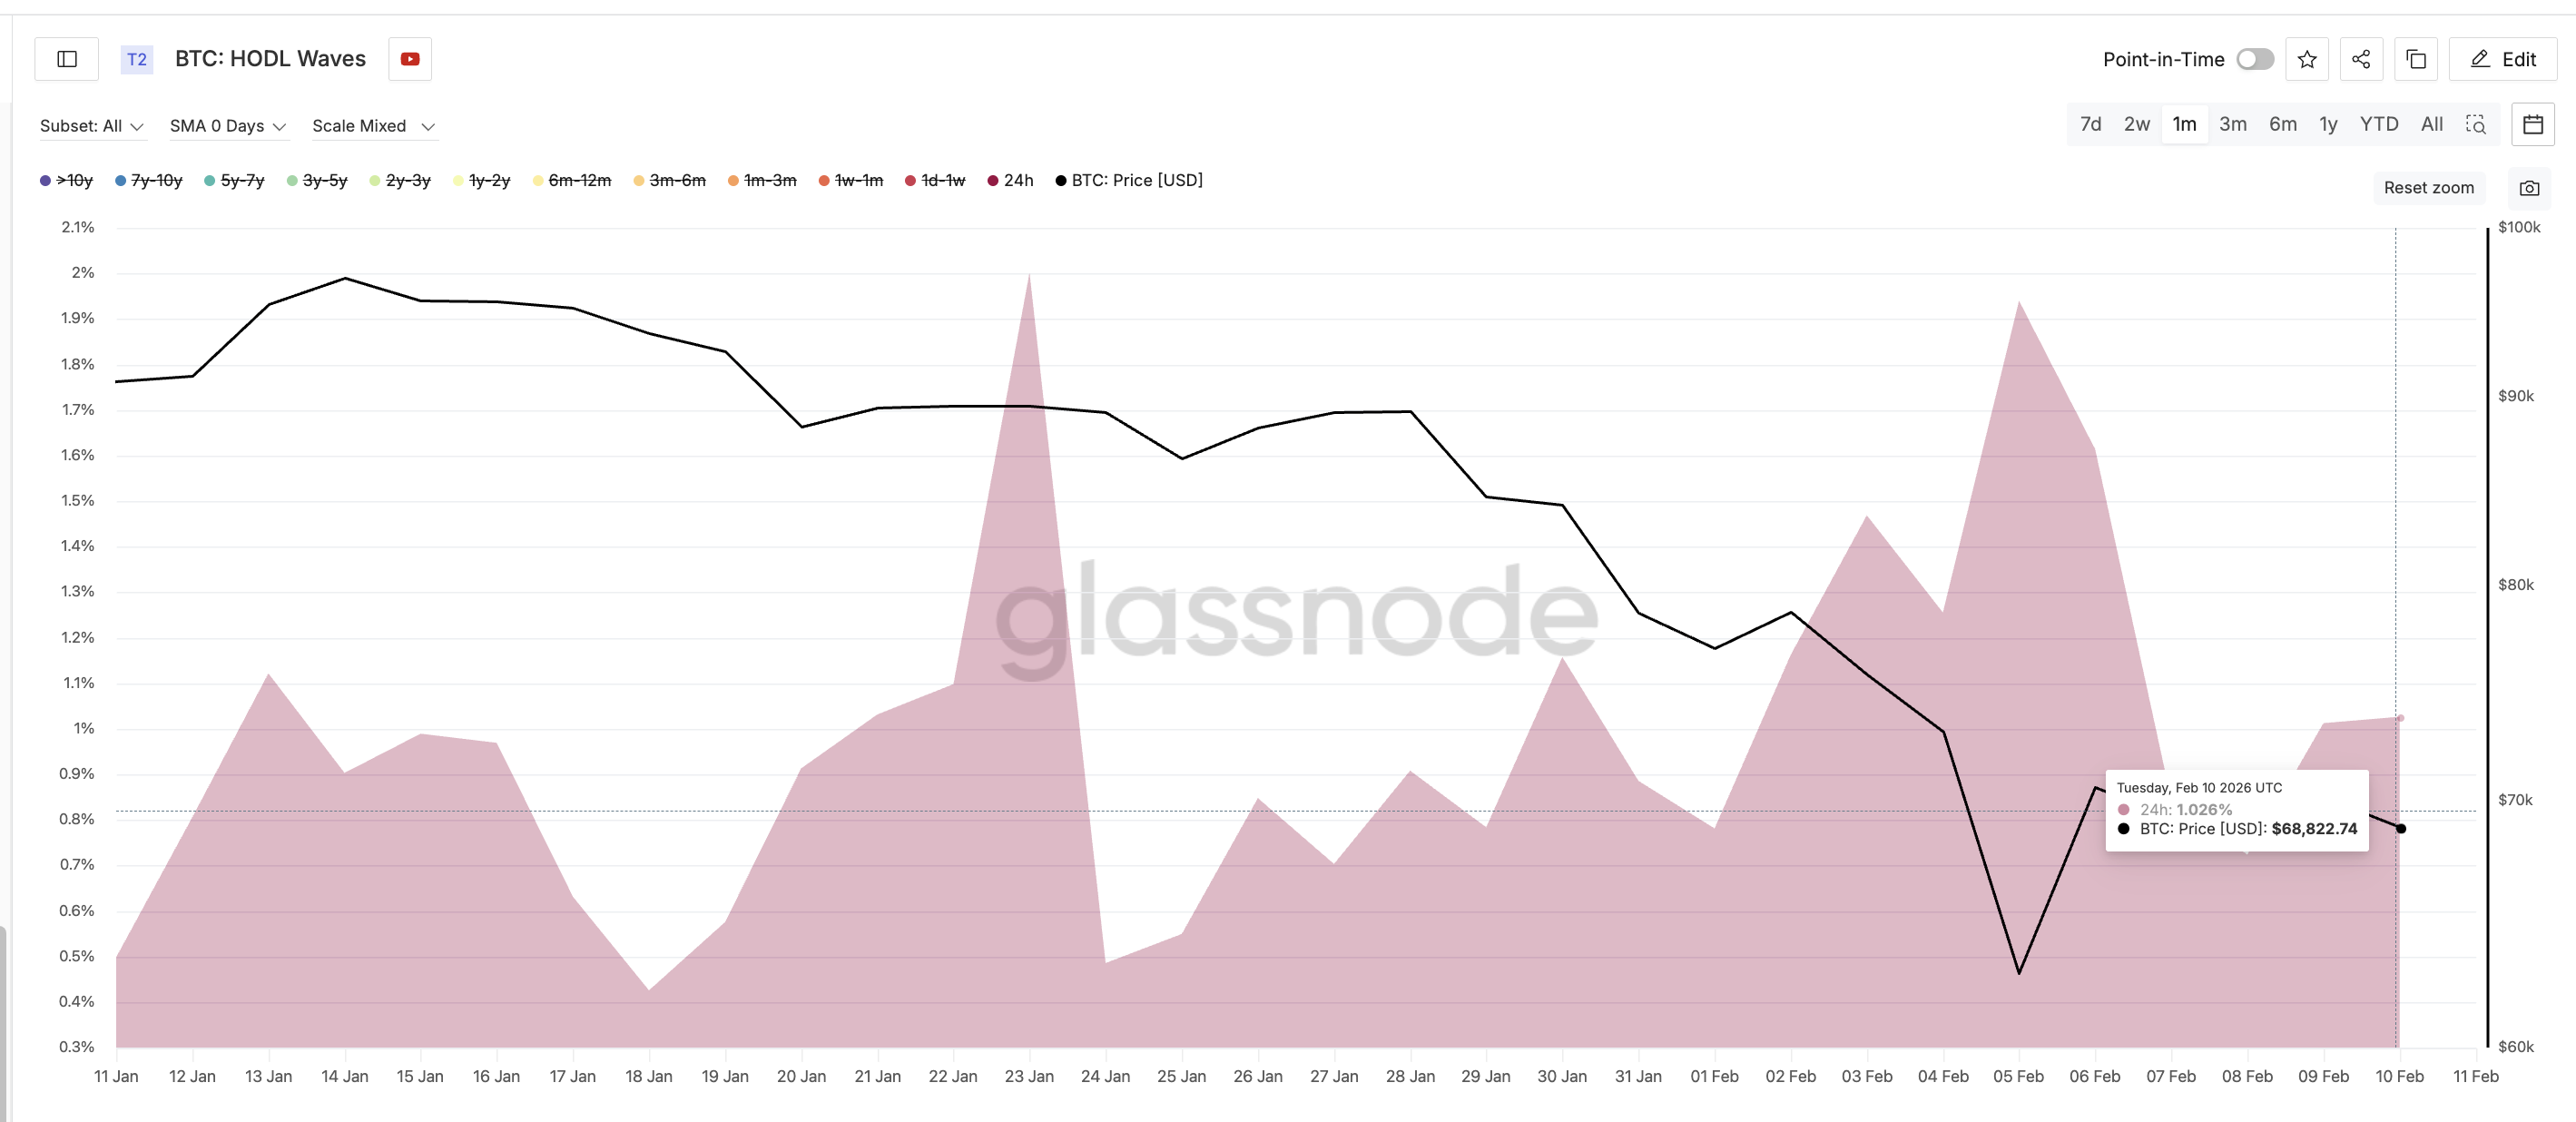
Strong hands are selling, while short-term traders (speculative money) are absorbing supply. This combination weakens market stability.
$63,000 Cost Basis Cluster Becomes the Critical Bitcoin Price Zone
To find potential support, traders look at the UTXO Realized Price Distribution or the URPD metric. This metric shows where investors bought their coins and highlights major cost basis clusters. These zones often act as support because holders defend their entry prices.
Sponsored
Sponsored
Right now, the strongest cluster sits near $63,100. Around 1.3% of the total Bitcoin supply is concentrated in this range. That makes $63,000 a major demand wall. On the price chart, Bitcoin has already lost $67,350 and is drifting lower toward this zone.
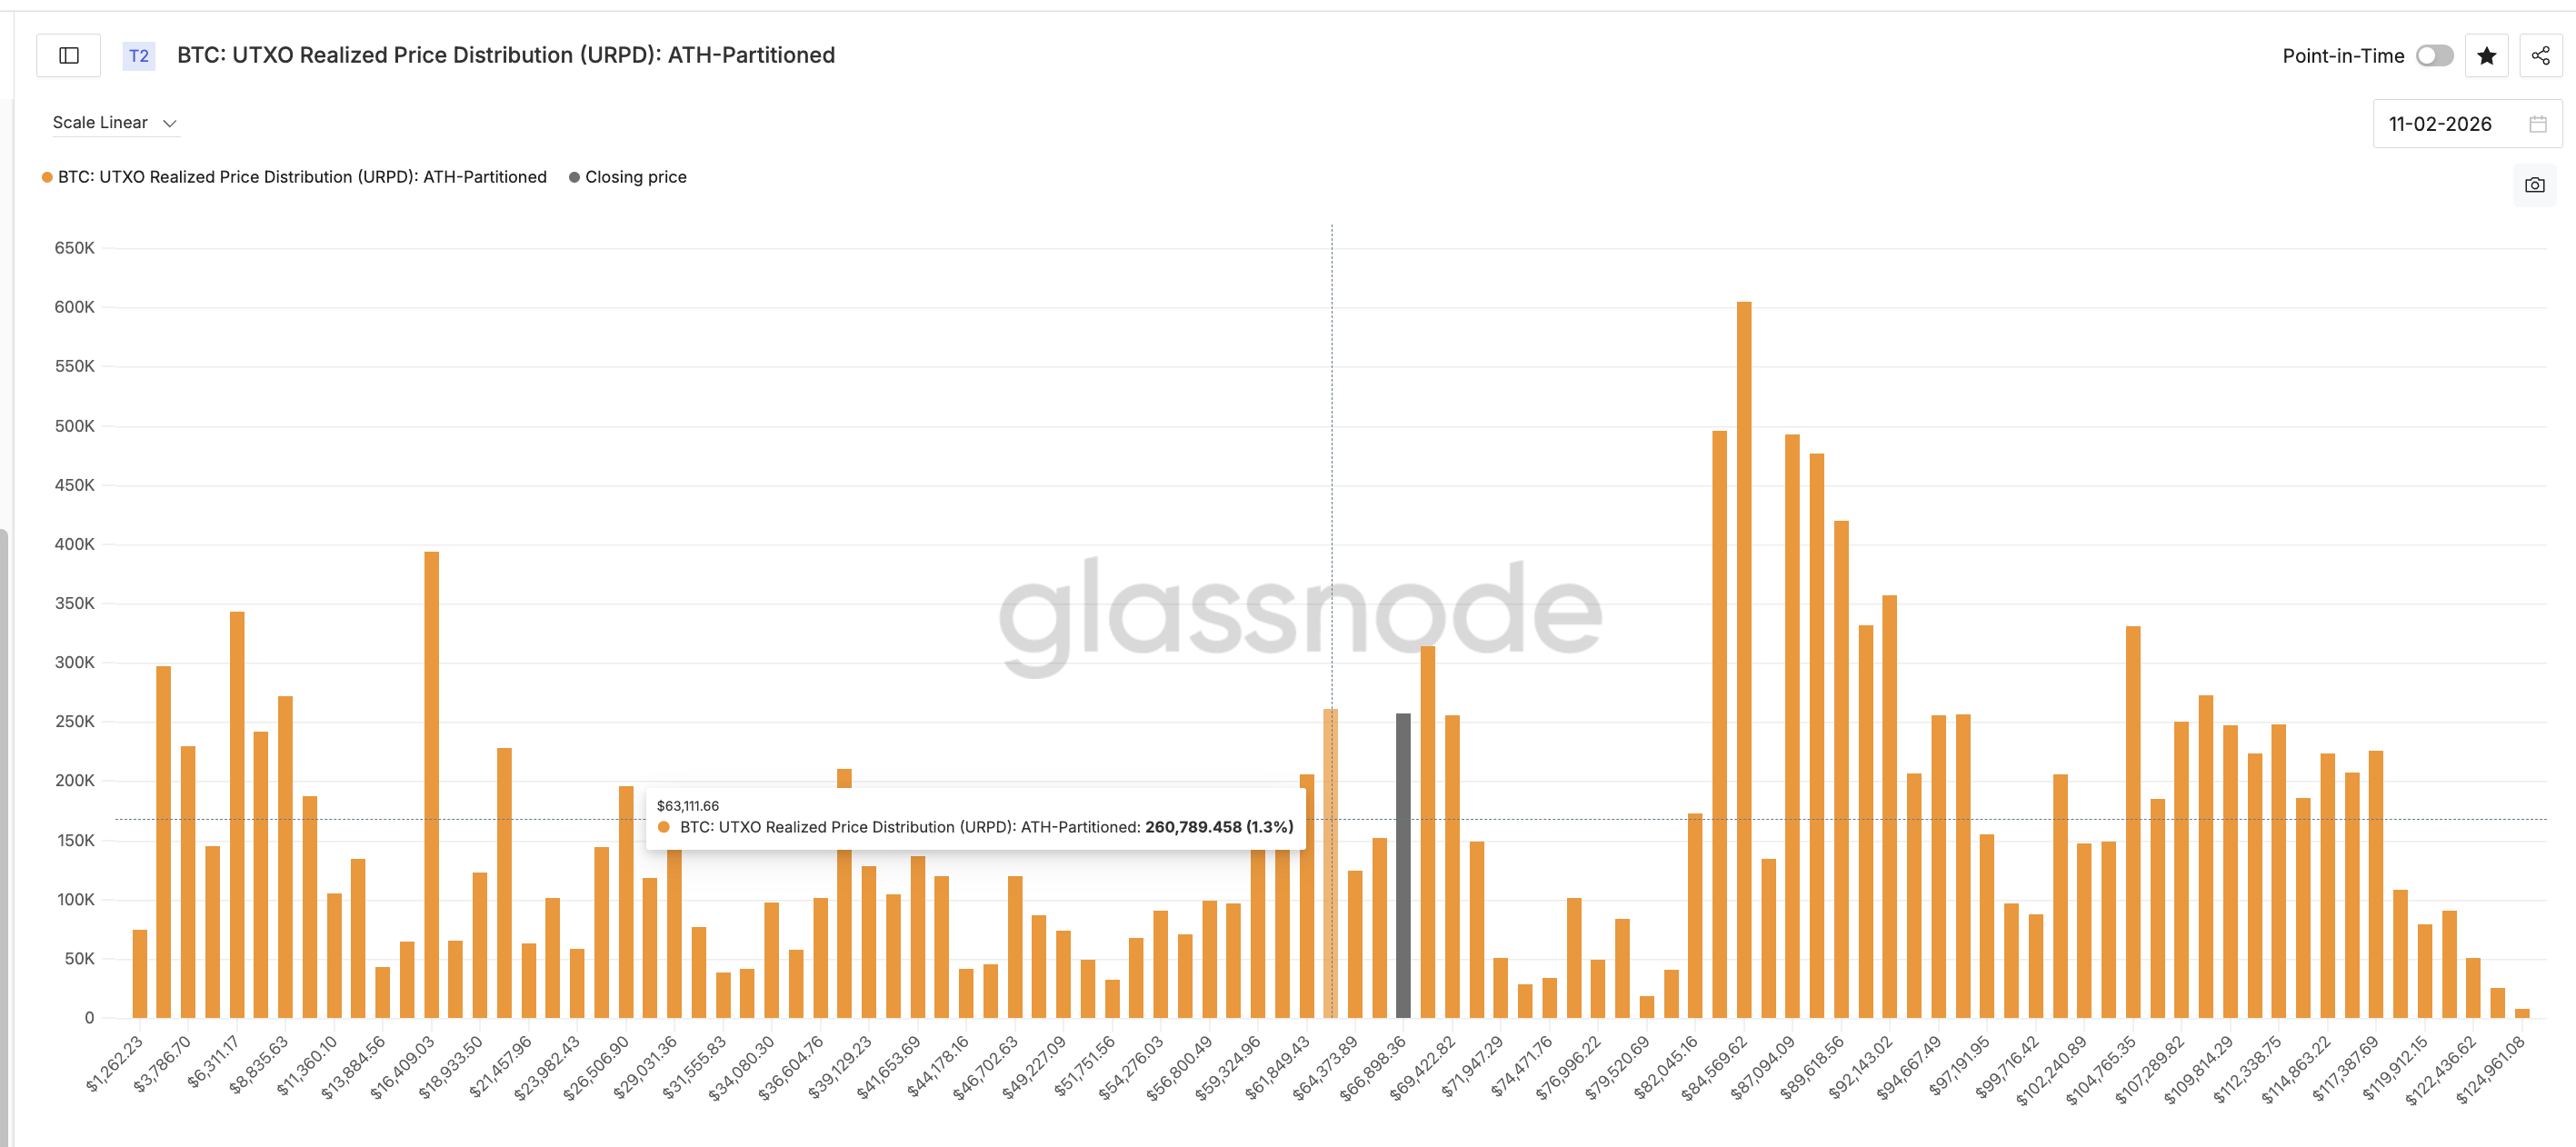
If $63,000 holds ($63,240 on the price chart), buyers may try to stabilize the market because many holders are still near break-even. If it breaks, risk rises sharply. A failure would push large groups into losses and could trigger accelerated selling. Below $63,000, the next major zone sits near $57,740, and deeper panic could open levels near $42,510.
That would mark a full reset of the recent structure. On the upside, recovery remains difficult. Bitcoin must first reclaim $72,130 to reduce pressure. Only a move above $79,290 would weaken the broader downtrend. Until then, rallies are likely to remain corrective.
Right now, Bitcoin is caught between fading conviction and rising speculation. While the bear flag failure set the path, the holder selling is reinforcing it. Everything now depends on $63,000. It remains the market’s last clear line of defense.