Bitcoin Price Could Still Break Out Despite the Dip — Here’s How

Bitcoin’s price sharp fall (dip) to $106,200 right before Halloween spooked the market, wiping nearly 5% within hours. But what followed was equally quick — a near 4% rebound (surge) that pushed the price back above $108,700, turning a breakdown into a sharp bounce.
This dip-surge play has caught traders’ attention. It may not have been random volatility, but a calculated flush to reset market sentiment and prepare the ground for a possible bullish reversal. The charts now hint that this shakeout may have served a bigger purpose.
Sponsored
Sponsored
The Dip May Have Reset Bitcoin’s Near-Term Market Structure
Following the sudden fall, Bitcoin’s Relative Strength Index (RSI) — which measures buying versus selling strength — began to hold steady even as the price made a lower low between October 22 and 30. That created a bullish divergence, a setup that often signals sellers losing control while buyers slowly regain footing.
The reversal-specific RSI formation coincided with a near-complete inverse head-and-shoulders pattern. The latest Bitcoin price dip helped complete the right shoulder formation of this otherwise reversal-specific pattern. All BTC needs is a neckline breakout near $116,400 to surge higher.
Want more token insights like this? Sign up for Editor Harsh Notariya’s Daily Crypto Newsletter here.
Supporting this view is the Net Unrealized Profit/Loss (NUPL) metric from Glassnode, which shows the proportion of investors in profit or loss. It has now dropped to 0.483, one of its lowest readings in six months. Such levels usually appear when weaker traders exit and stronger hands hold their ground. A dropping NUPL also means low incentive to sell or book profits.
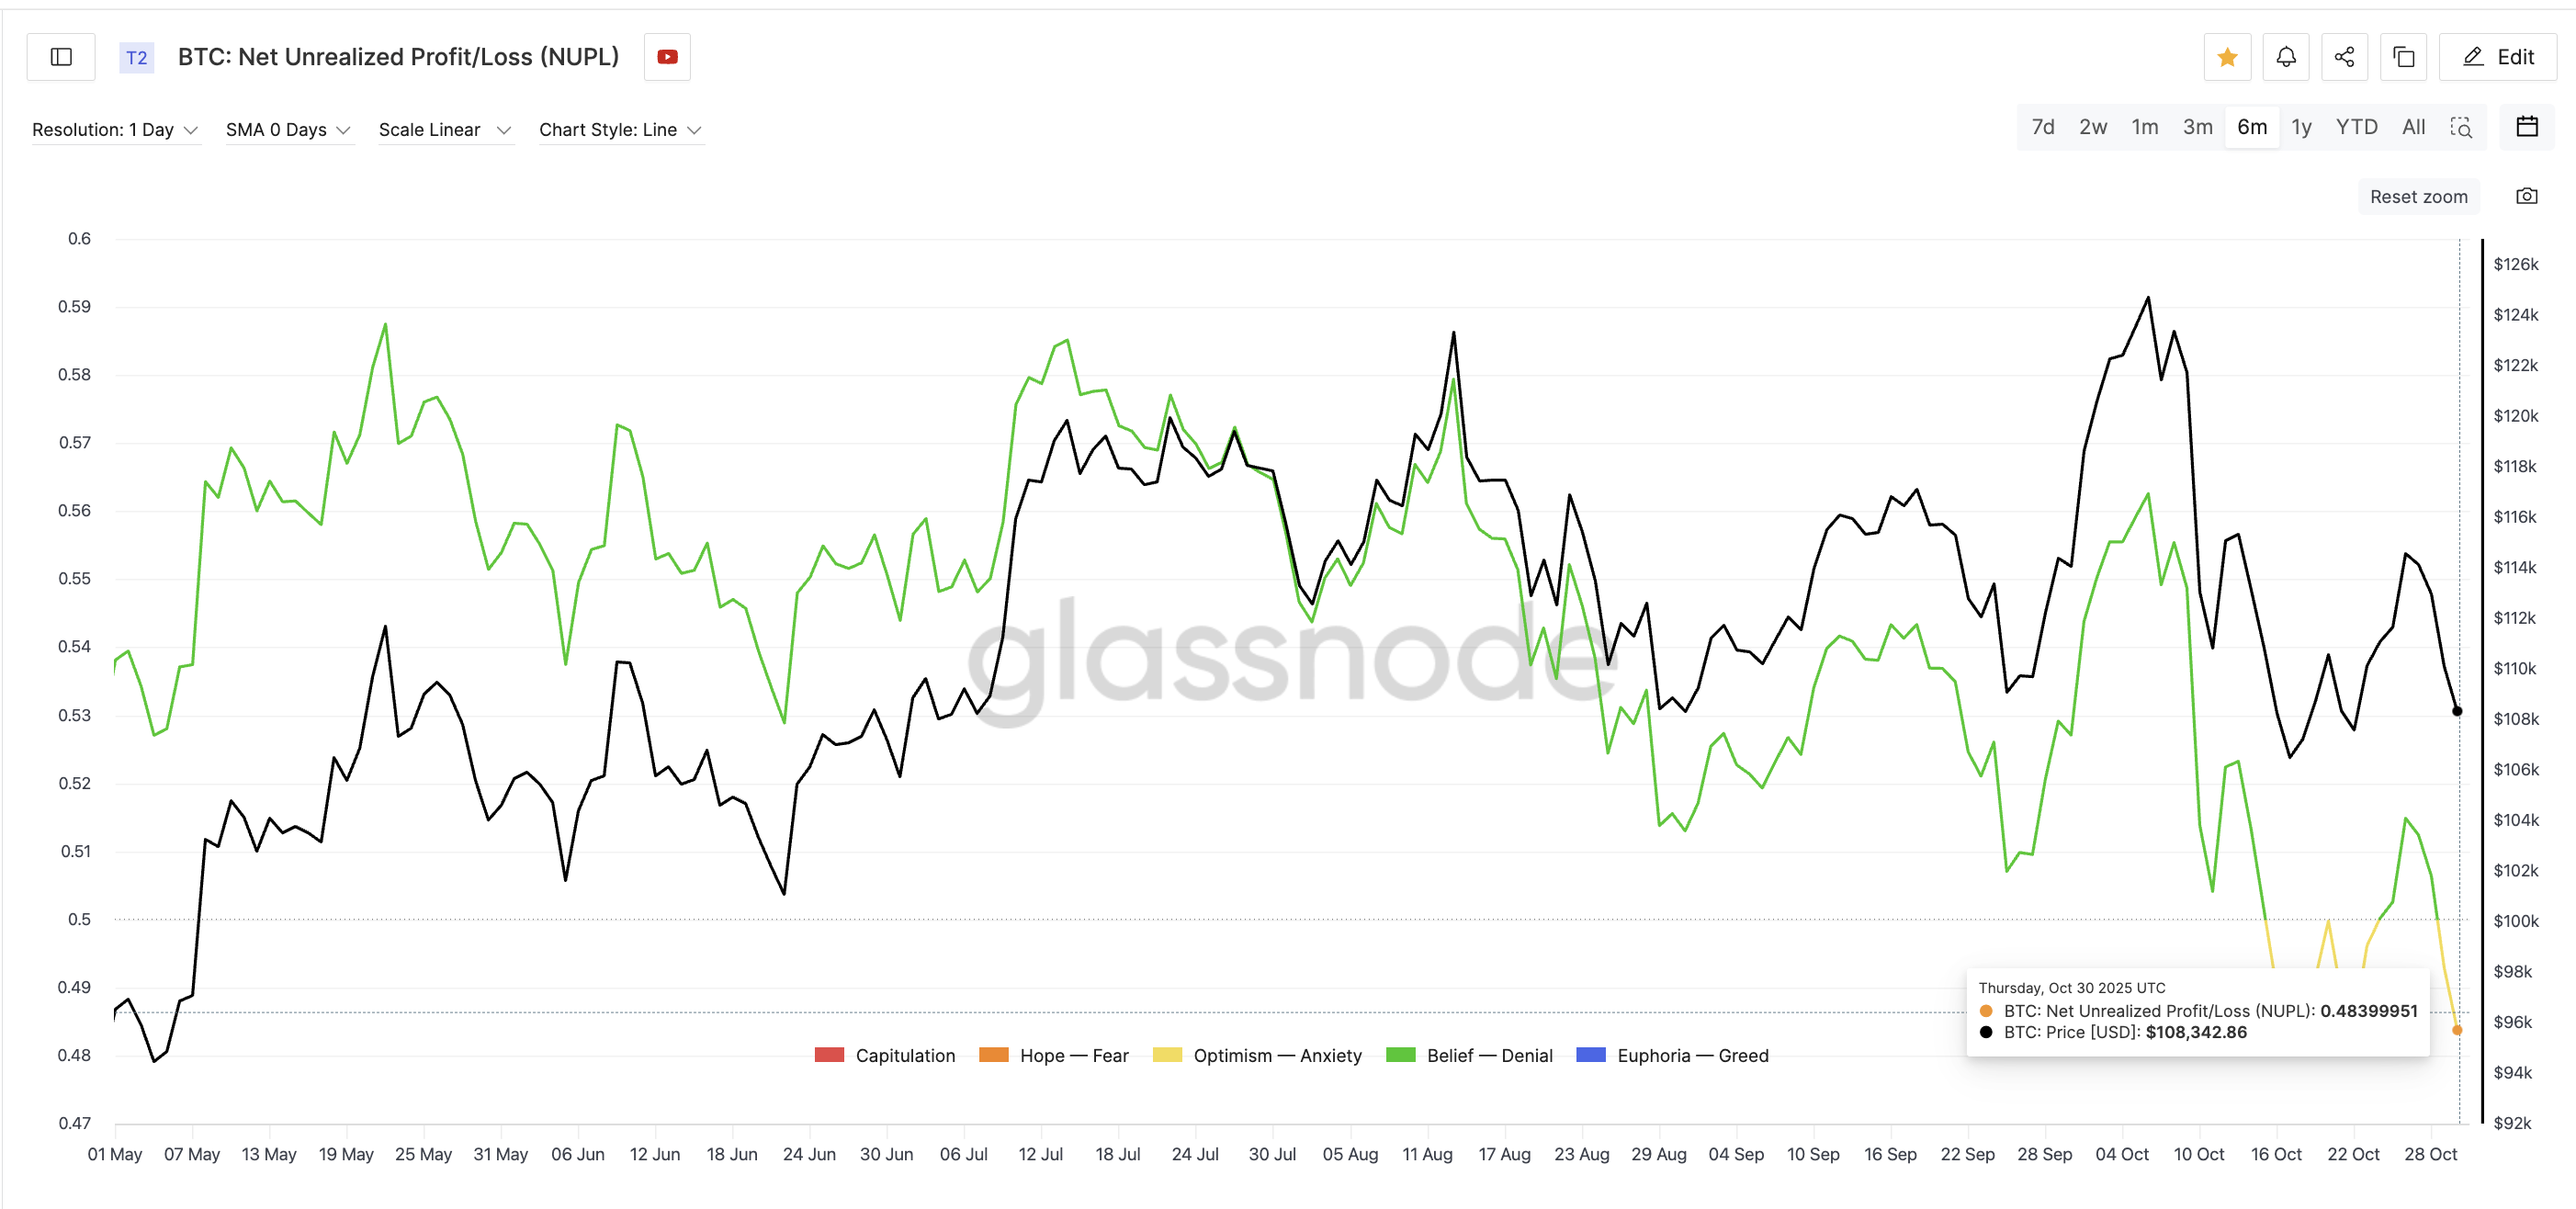
The last time NUPL touched these levels on October 17, Bitcoin rebounded 7.6%, rising from $106,498 to $114,583. This suggests that the latest dip may have flushed out short-term speculators and set up the base for another short-term rally.
Sponsored
Sponsored
$111,000 Could Decide If The Rebound Holds
If Bitcoin’s dip-surge play truly marks a turning point, the next key test lies near $111,000–$111,400.
According to the Cost-Basis Heatmap, which highlights where most coins were last bought, this range holds the heaviest concentration of supply, with roughly 172,700 BTC accumulated. At the current BTC price, that equals about $18.82 billion worth of Bitcoin sitting in this zone.
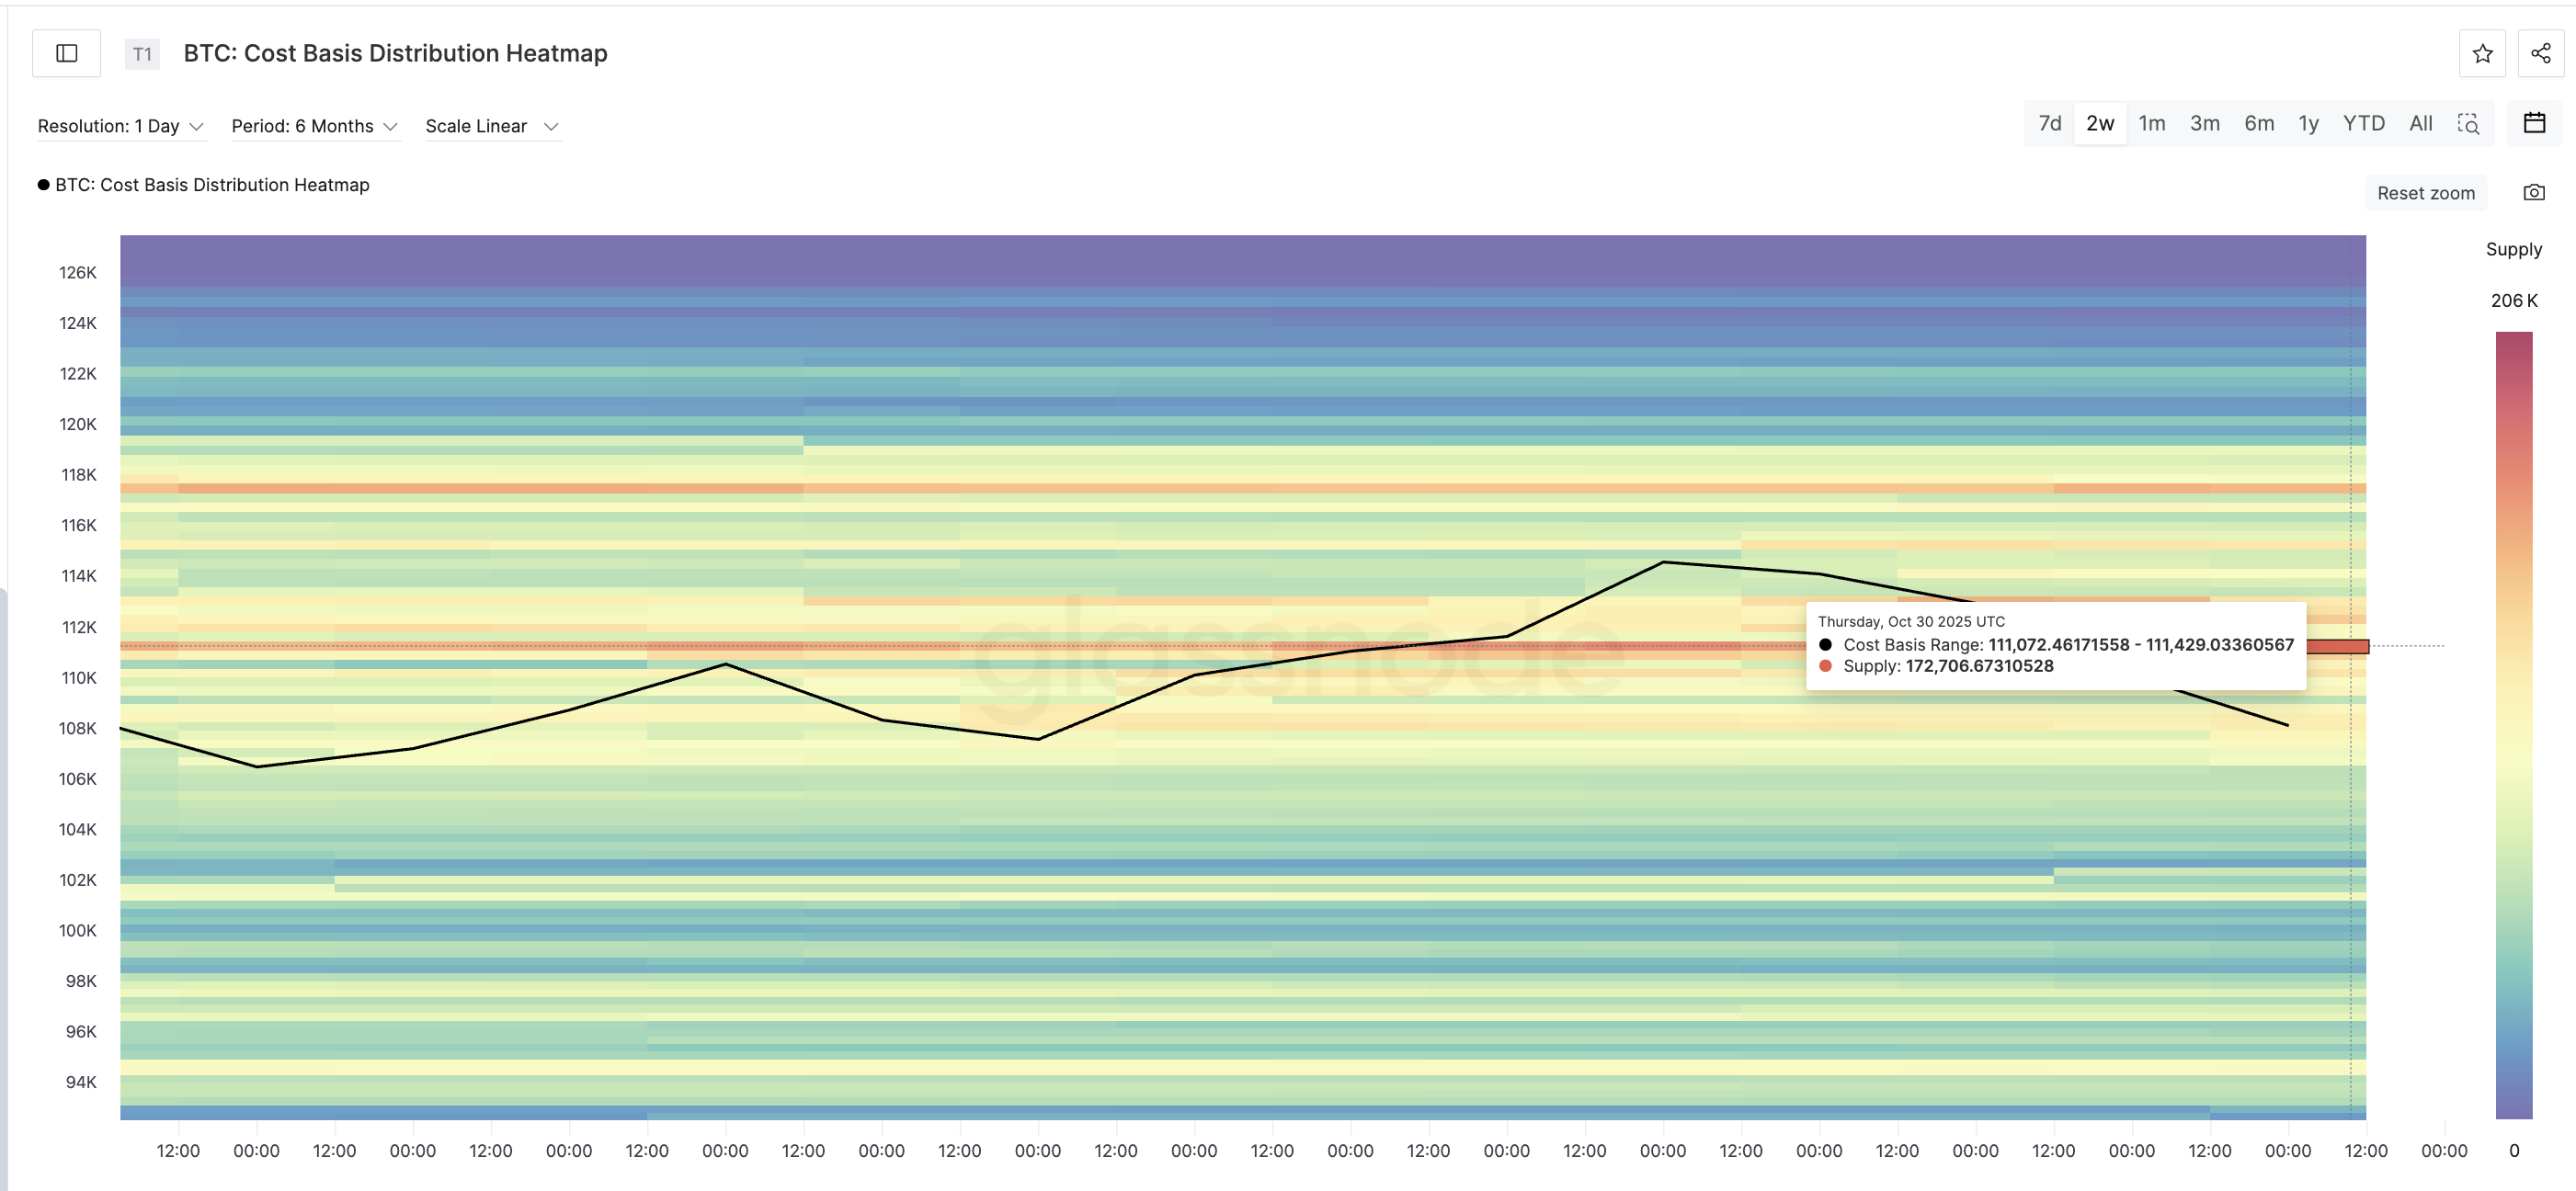
That makes it the first major hurdle for the recovery to prove itself. If Bitcoin price manages to break above this range, it would signal renewed buyer strength. The next resistance levels will come into play — which we’ll discuss in the price chart section — but for now, this zone remains the wall to watch.
Breakout or Fakeout? Key Bitcoin Price Levels That Will Confirm the Move
If Bitcoin closes above $116,400, the reversal pattern completes, confirming a bullish breakout with a 12.2% target toward $130,800. That would be a new Bitcoin price peak.
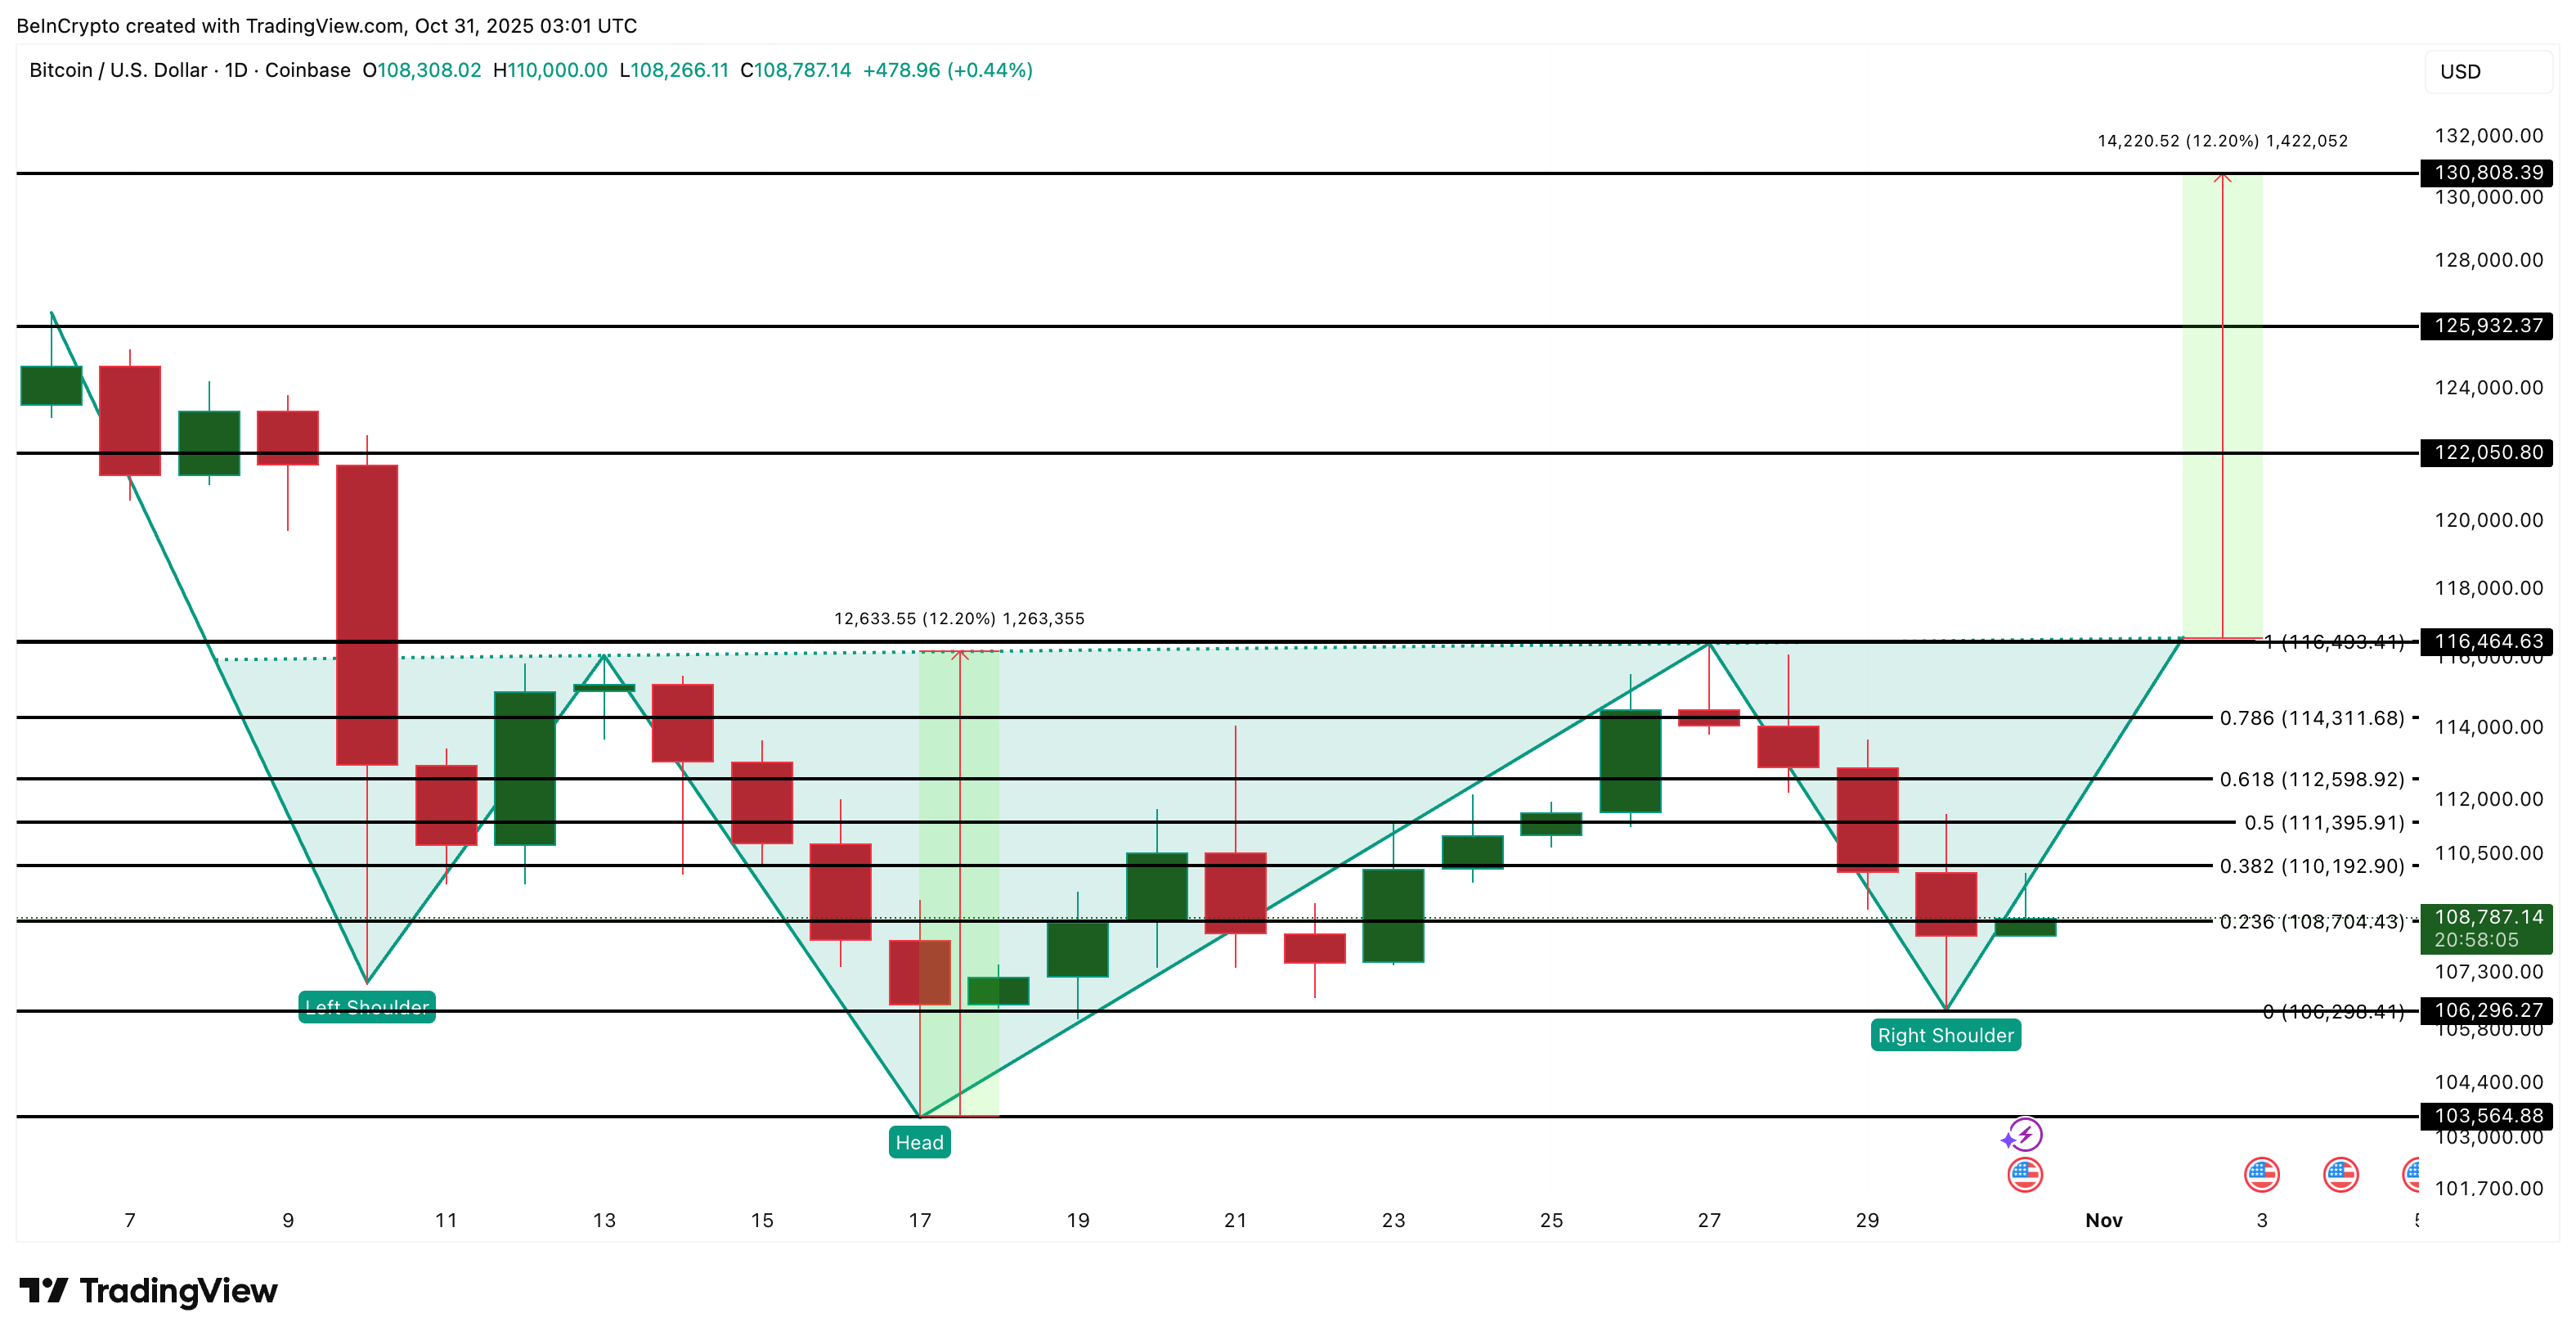
The next intermediate checkpoint could appear near $125,900 (near the previous all-time high), where short-term profit-taking may occur. However, if Bitcoin falls below $106,200, it would invalidate the bullish setup, likely sending prices toward $103,500.
That would mean the market needs more time to stabilize before attempting another move higher.