Bitcoin Price Prediction For March 2026: Bounce And Fall?

The Bitcoin price enters March bruised. February delivered close to 15% losses, echoing last year’s February, which saw the Bitcoin price drop by over 17%.
With five consecutive red months now on the books, starting from October 2025, and a median March return of −1.31%, the seasonal backdrop offers little comfort. But beneath the surface, a shift may be forming. Here is what the data shows heading into March.
Bitcoin Price Still Trades as a Risk Asset
One of the most pressing concerns for the Bitcoin price right now is its sustained correlation with US equities. This reflects in the historical sightings as a weak S&P 500 month-on-month ensured a dismal February for Bitcoin.
Want more token insights like this? Sign up for Editor Harsh Notariya’s Daily Crypto Newsletter here.
As of March 1, the 30-day rolling correlation between Bitcoin and the S&P 500 stands at 0.55, up from around 0.50 in October 2025.
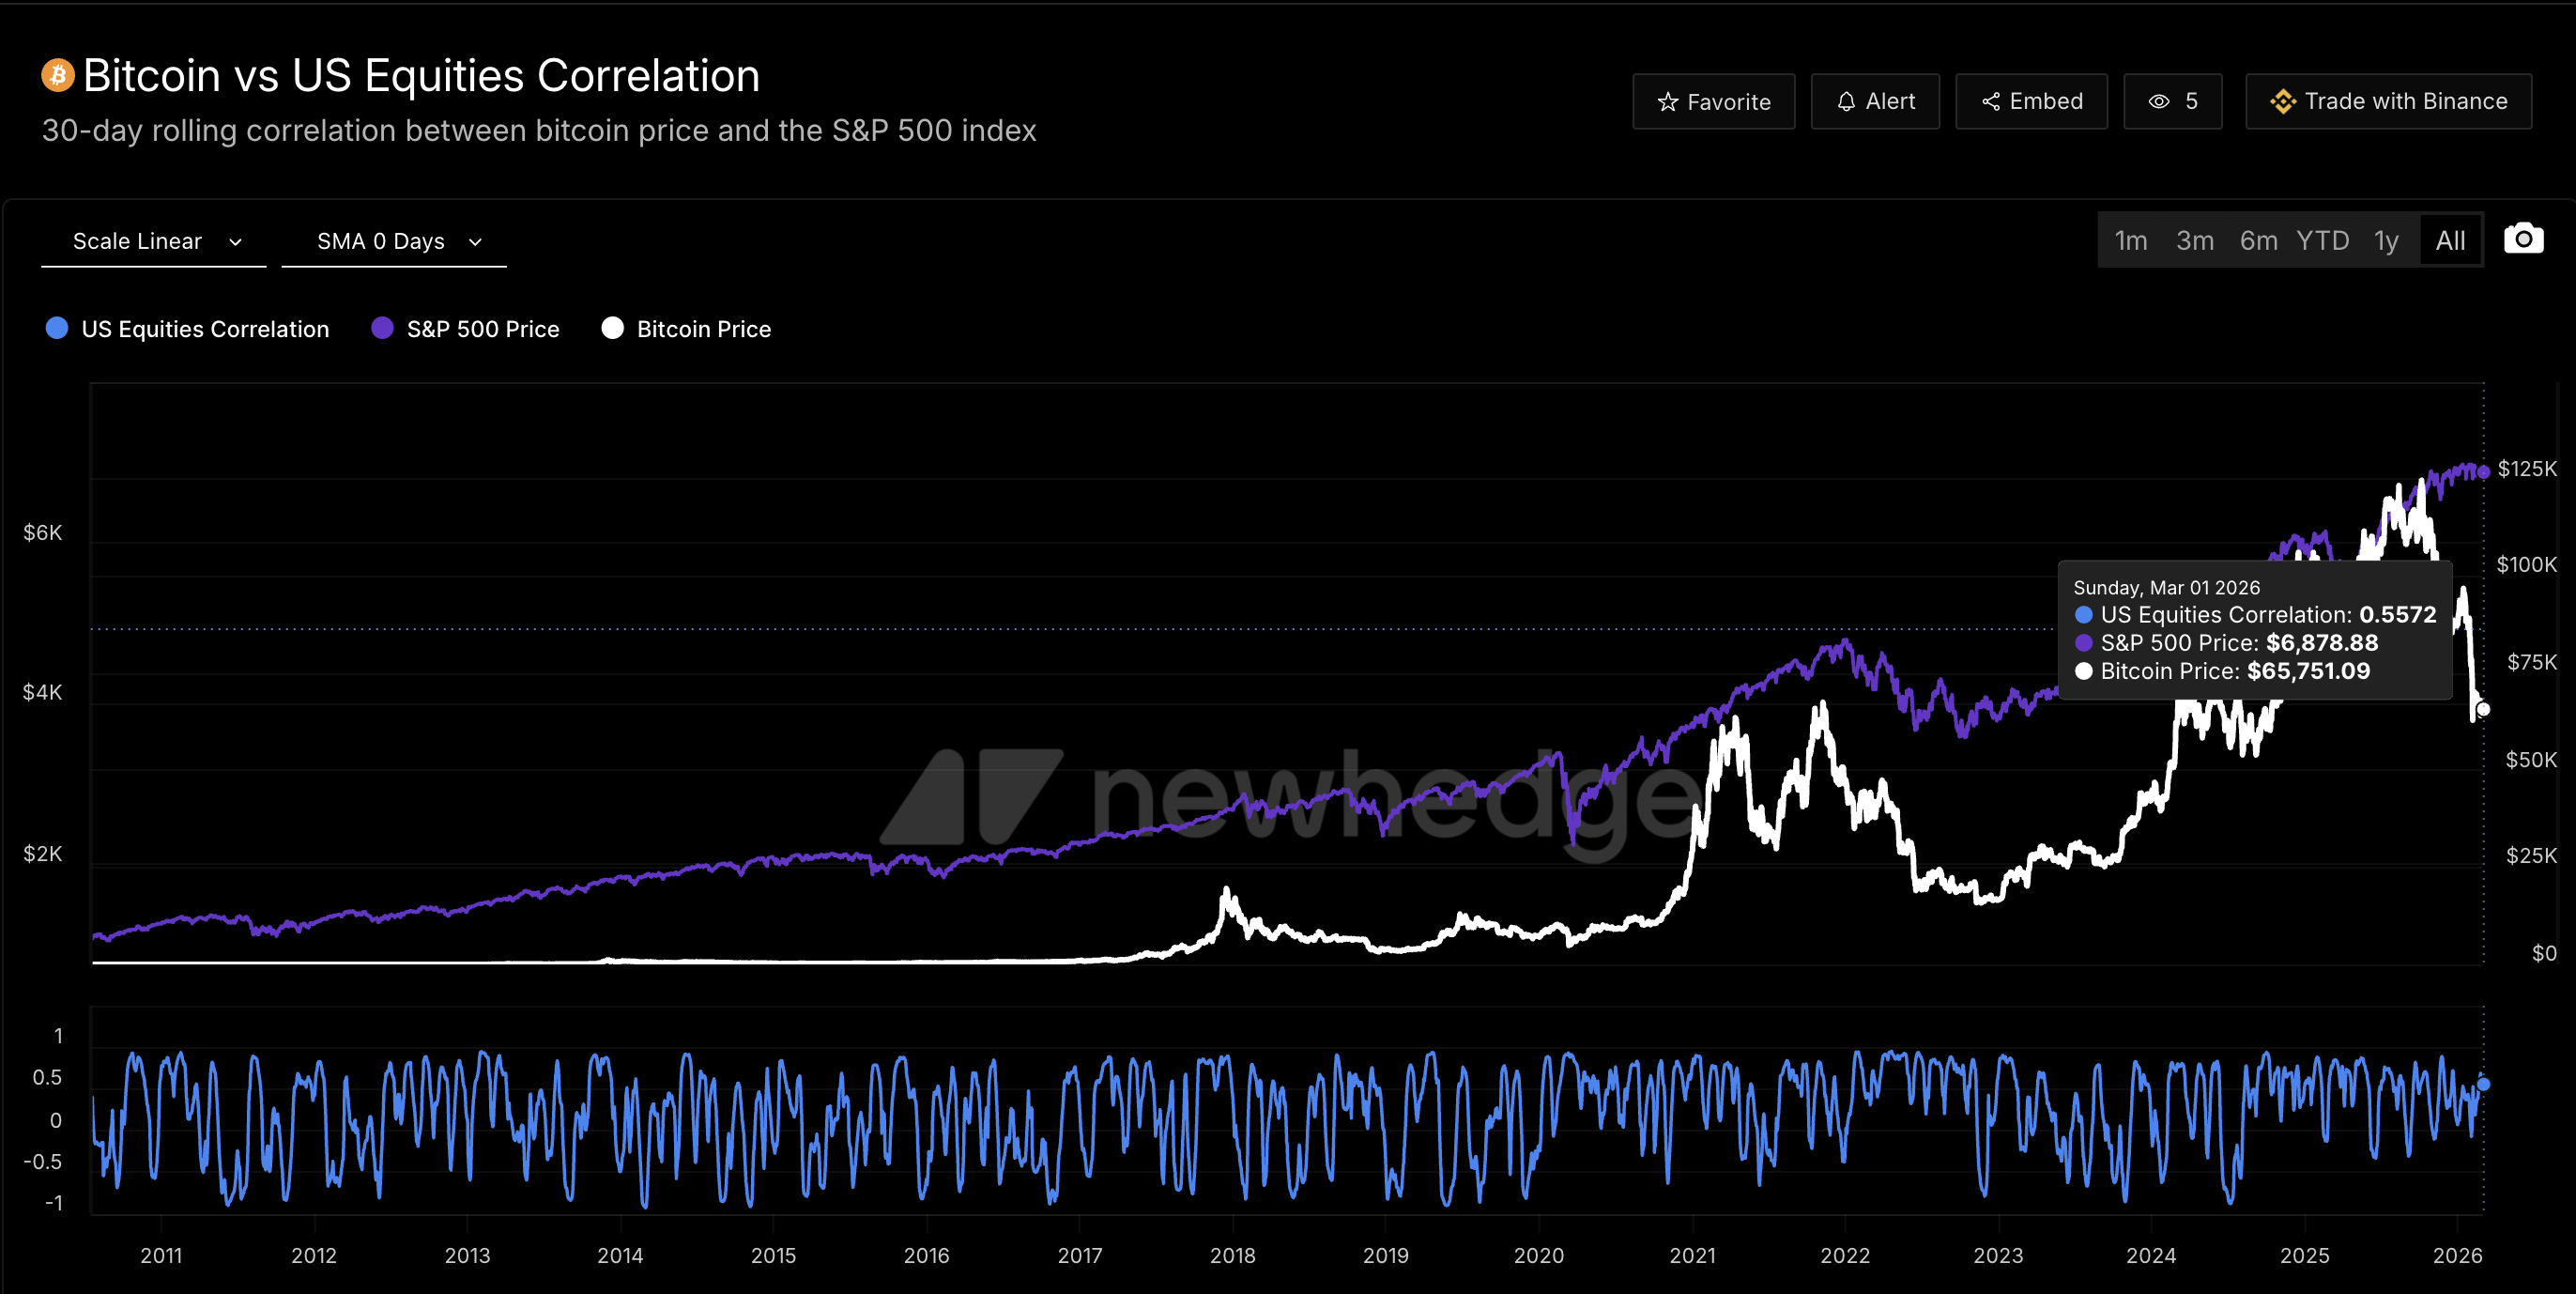
This means the Bitcoin price continues to move largely in step with stocks, undermining its appeal as a hedge against traditional market risk. With Trump’s new global tariffs adding pressure to equities and potential US-Iran military escalation weighing on risk appetite, Bitcoin’s risk-on behavior keeps it vulnerable.
Kevin Crowther, Founder of KC Private Wealth, emphasized this dynamic.
“Bitcoin’s high correlation to software stocks weakens its case as a hedge asset in times of uncertainty, and so as Trump continues to elevate economic uncertainty, continued BTC weakness should be expected,” Crowther said.
Meanwhile, gold and silver continue to surge while Bitcoin bleeds. However, if geopolitical tensions ease, particularly around Iran, risk sentiment could shift. And if the gold and silver trade becomes saturated, capital could begin rotating into Bitcoin as the next uncrowded allocation. That rotation hinges on the equity correlation breaking.
Bitcoin ETF Outflows Are Fading: A Quiet Shift
While the macro picture remains challenging, spot Bitcoin ETF data tells a more nuanced story. February marked the fourth consecutive month of net outflows, but the trend is shifting sharply.
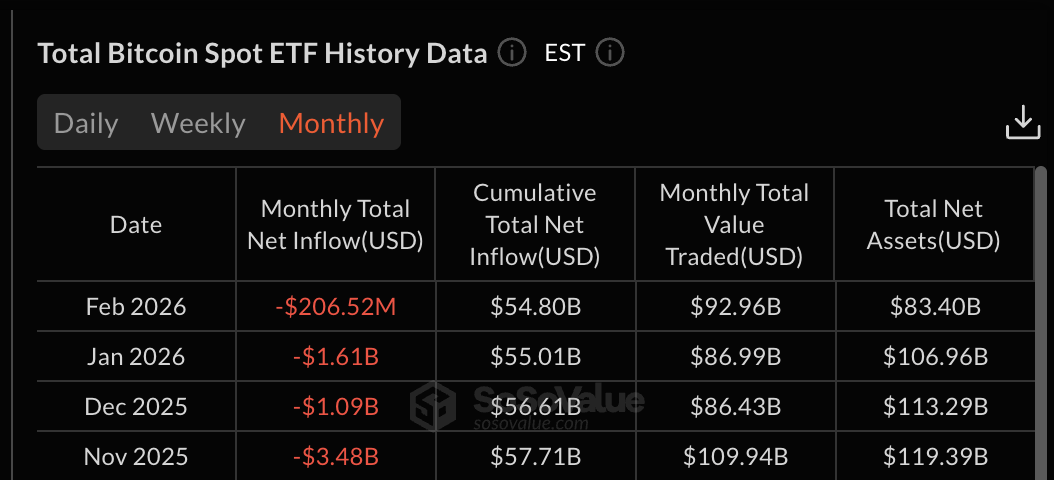
November 2025 saw $3.48 billion in outflows. December brought $1.09 billion, January $1.61 billion, and February closed at just $206.52 million — a 94% reduction from November’s peak.
Orkun Mahir Kılıç, Co-Founder of Citrea, noted that these outflows reflect positioning adjustments rather than a structural retreat.
“The ETF outflows are more consistent with deleveraging than institutional abandonment. For flows to reverse meaningfully, markets need clearer macro direction and lower volatility,” Kılıç explained in an exclusive quote to BeInCrypto.
Nima Beni, Founder of Bitlease, was more direct about what the data signals, especially taking BlackRock’s IBIT outflow into account:
“ETF outflows are retail panic, creating institutional opportunity. BlackRock’s $2.13B IBIT outflow matters less than the fact that 94% of ETF Bitcoin holdings remained despite maximum fear. That’s institutional conviction, not abandonment,” Beni stated.
Overall, the experts didn’t seem perturbed by the ETF outflow streak.
Selling Pressure Is Exhausting Across the Board – The Bounce Catalyst?
Beyond ETFs, on-chain data shows that selling from both long-term holders and Bitcoin miners is drying up rapidly.
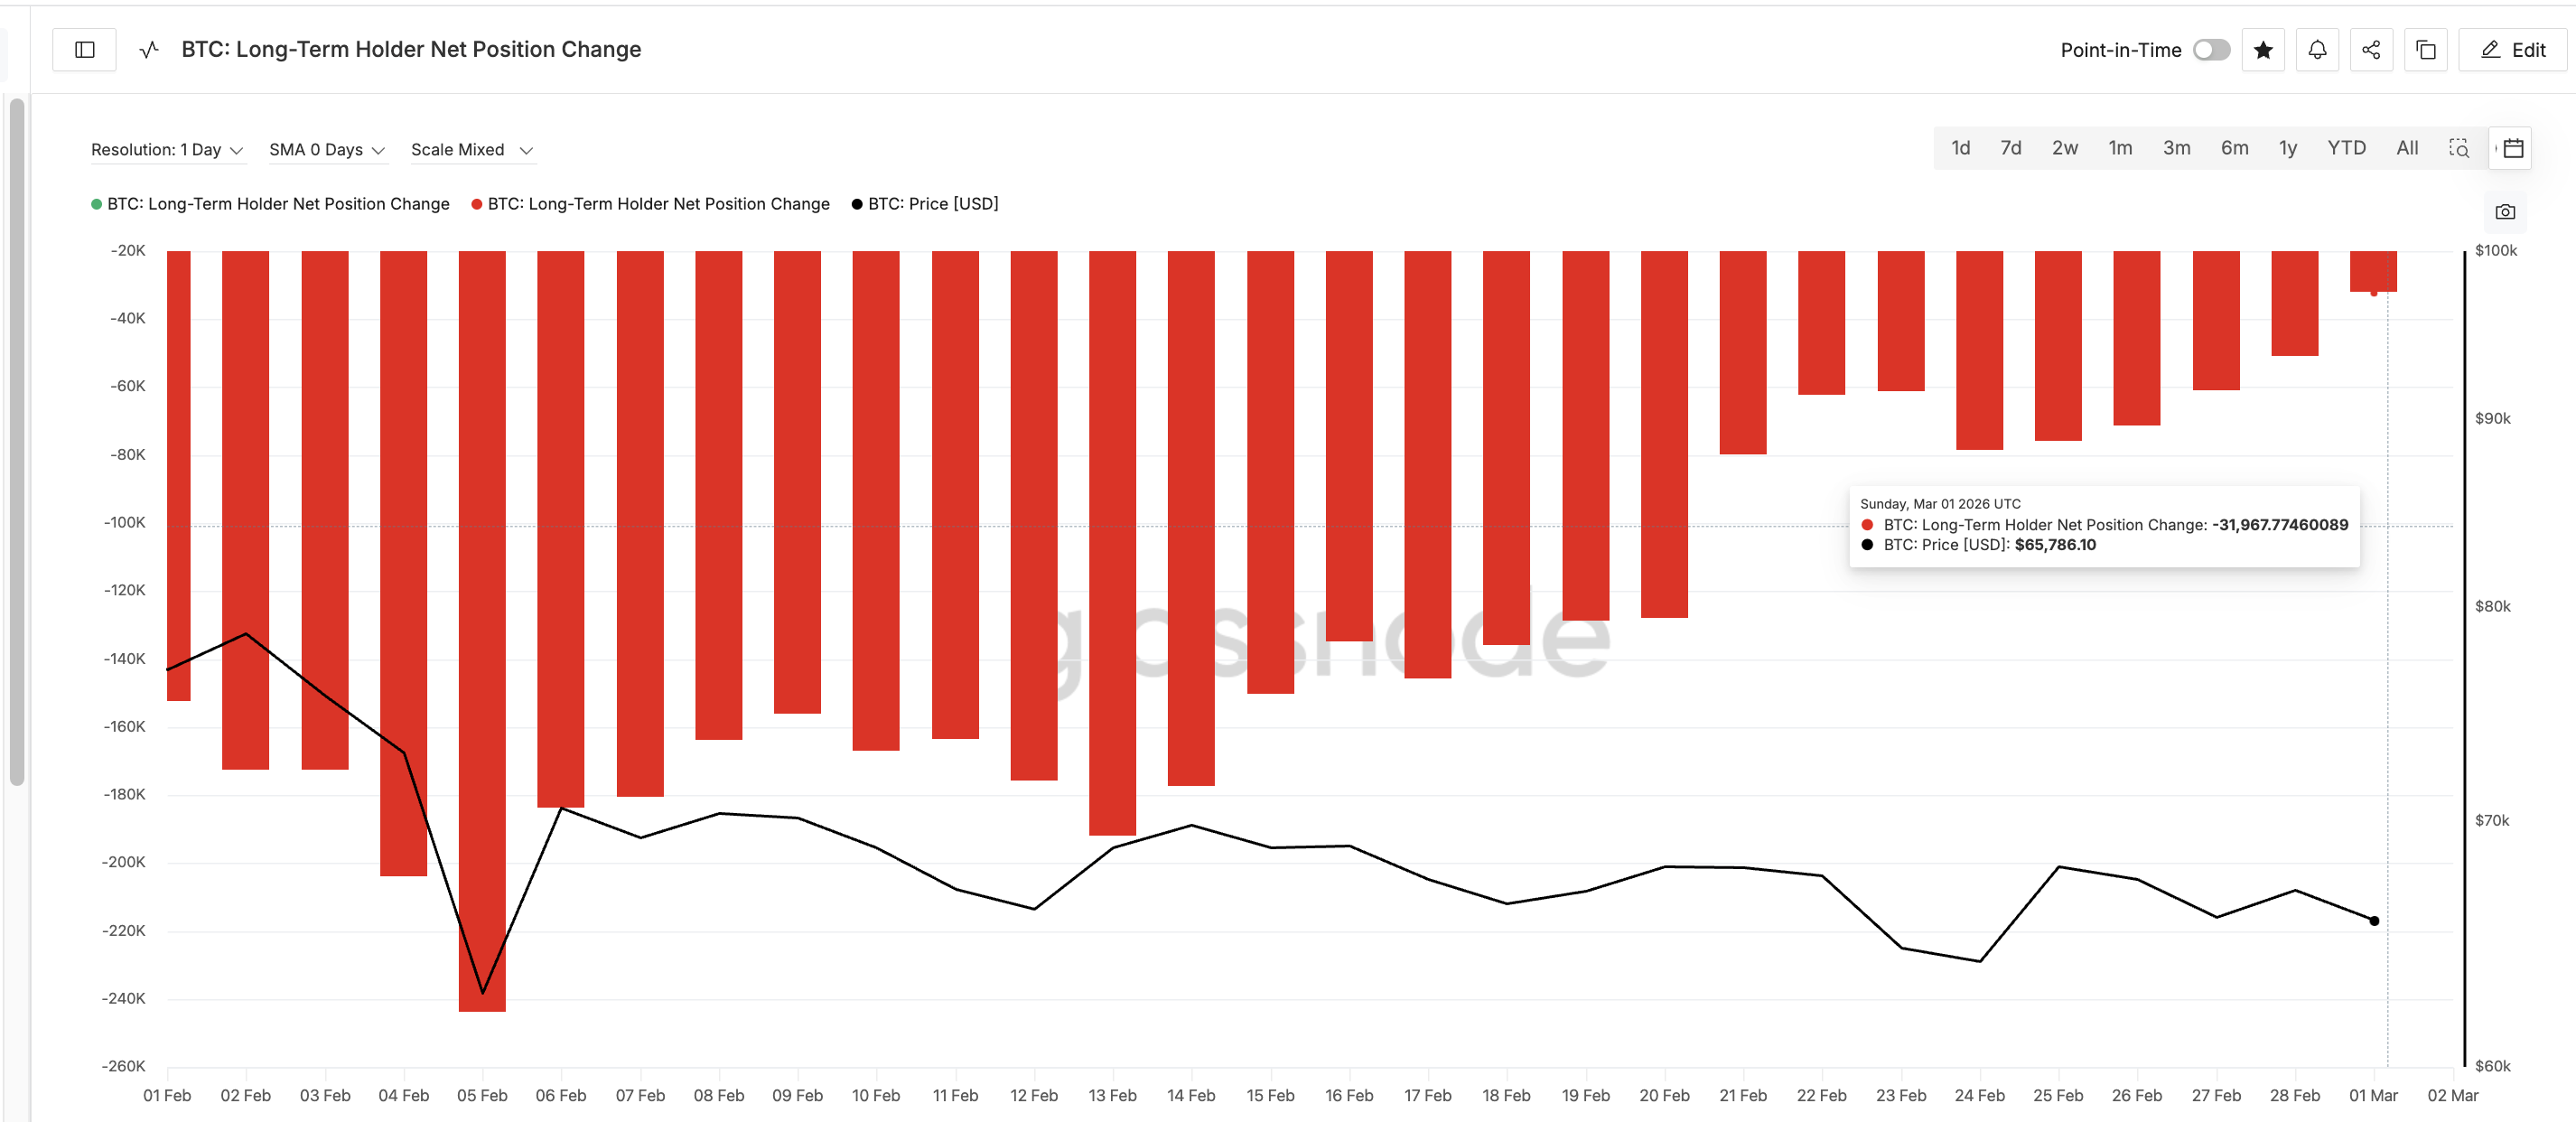
Long-term holders — wallets that have held Bitcoin for 365 days or more — are a critical group for gauging market direction. When their selling ends, the Bitcoin price tends to stabilize and recover. Throughout February, their net selling has collapsed. On February 5, the 30-day rolling net position change for long-term holders stood at −243,737 BTC. By March 1, that figure had fallen to just −31,967 BTC, an 87% reduction.
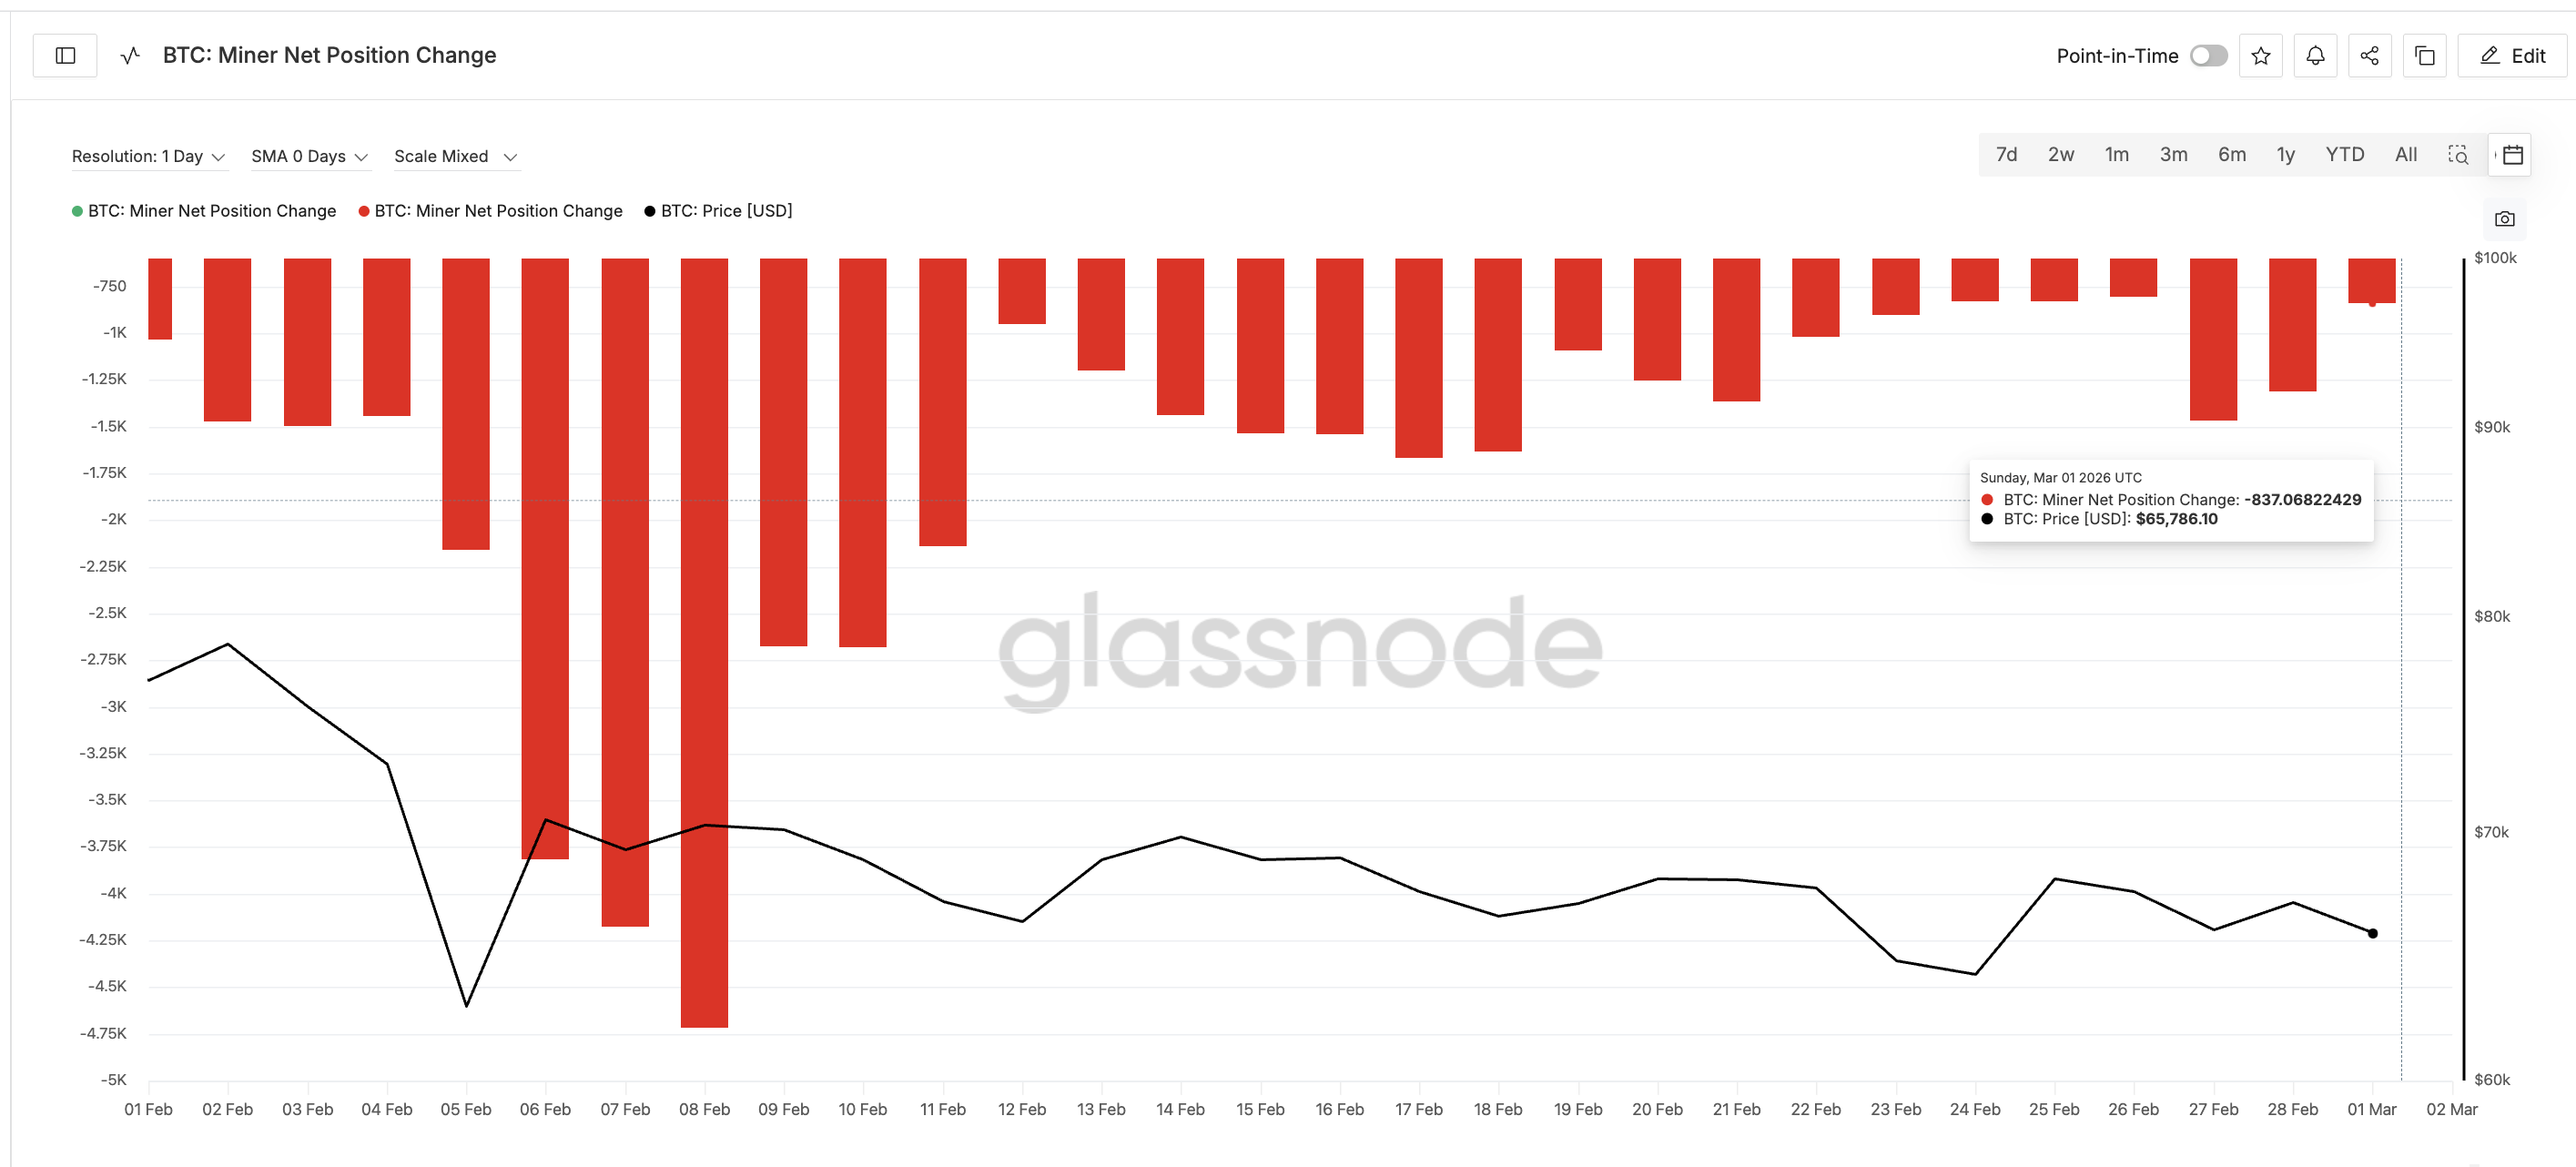
Miner behavior mirrors this trend. Bitcoin miners, who sell BTC to cover operational costs, saw peak capitulation around February 8 when net selling hit −4,718 BTC. By March 1, that had eased to −837 BTC, a sharp decline that suggests the worst of miner capitulation may be behind us.
Han Tan, Chief Market Analyst at Bybit, offered a key distinction here, taking the negative hash rate growth into account.
“Bitcoin miners aren’t capitulating; they’re making strategic diversifications. The drawdown in the hashrate is only to be expected in light of Bitcoin’s price plummet, but does not imply structural capitulation,” Tan noted.
Negative hash rate growth means the total computing power securing Bitcoin is falling instead of rising. This usually happens when miners turn off machines because mining becomes less profitable, often due to lower Bitcoin prices or higher energy costs. This explanation validates what Tan just highlighted.
Whales Are Accumulating Near the 20-Day SMA
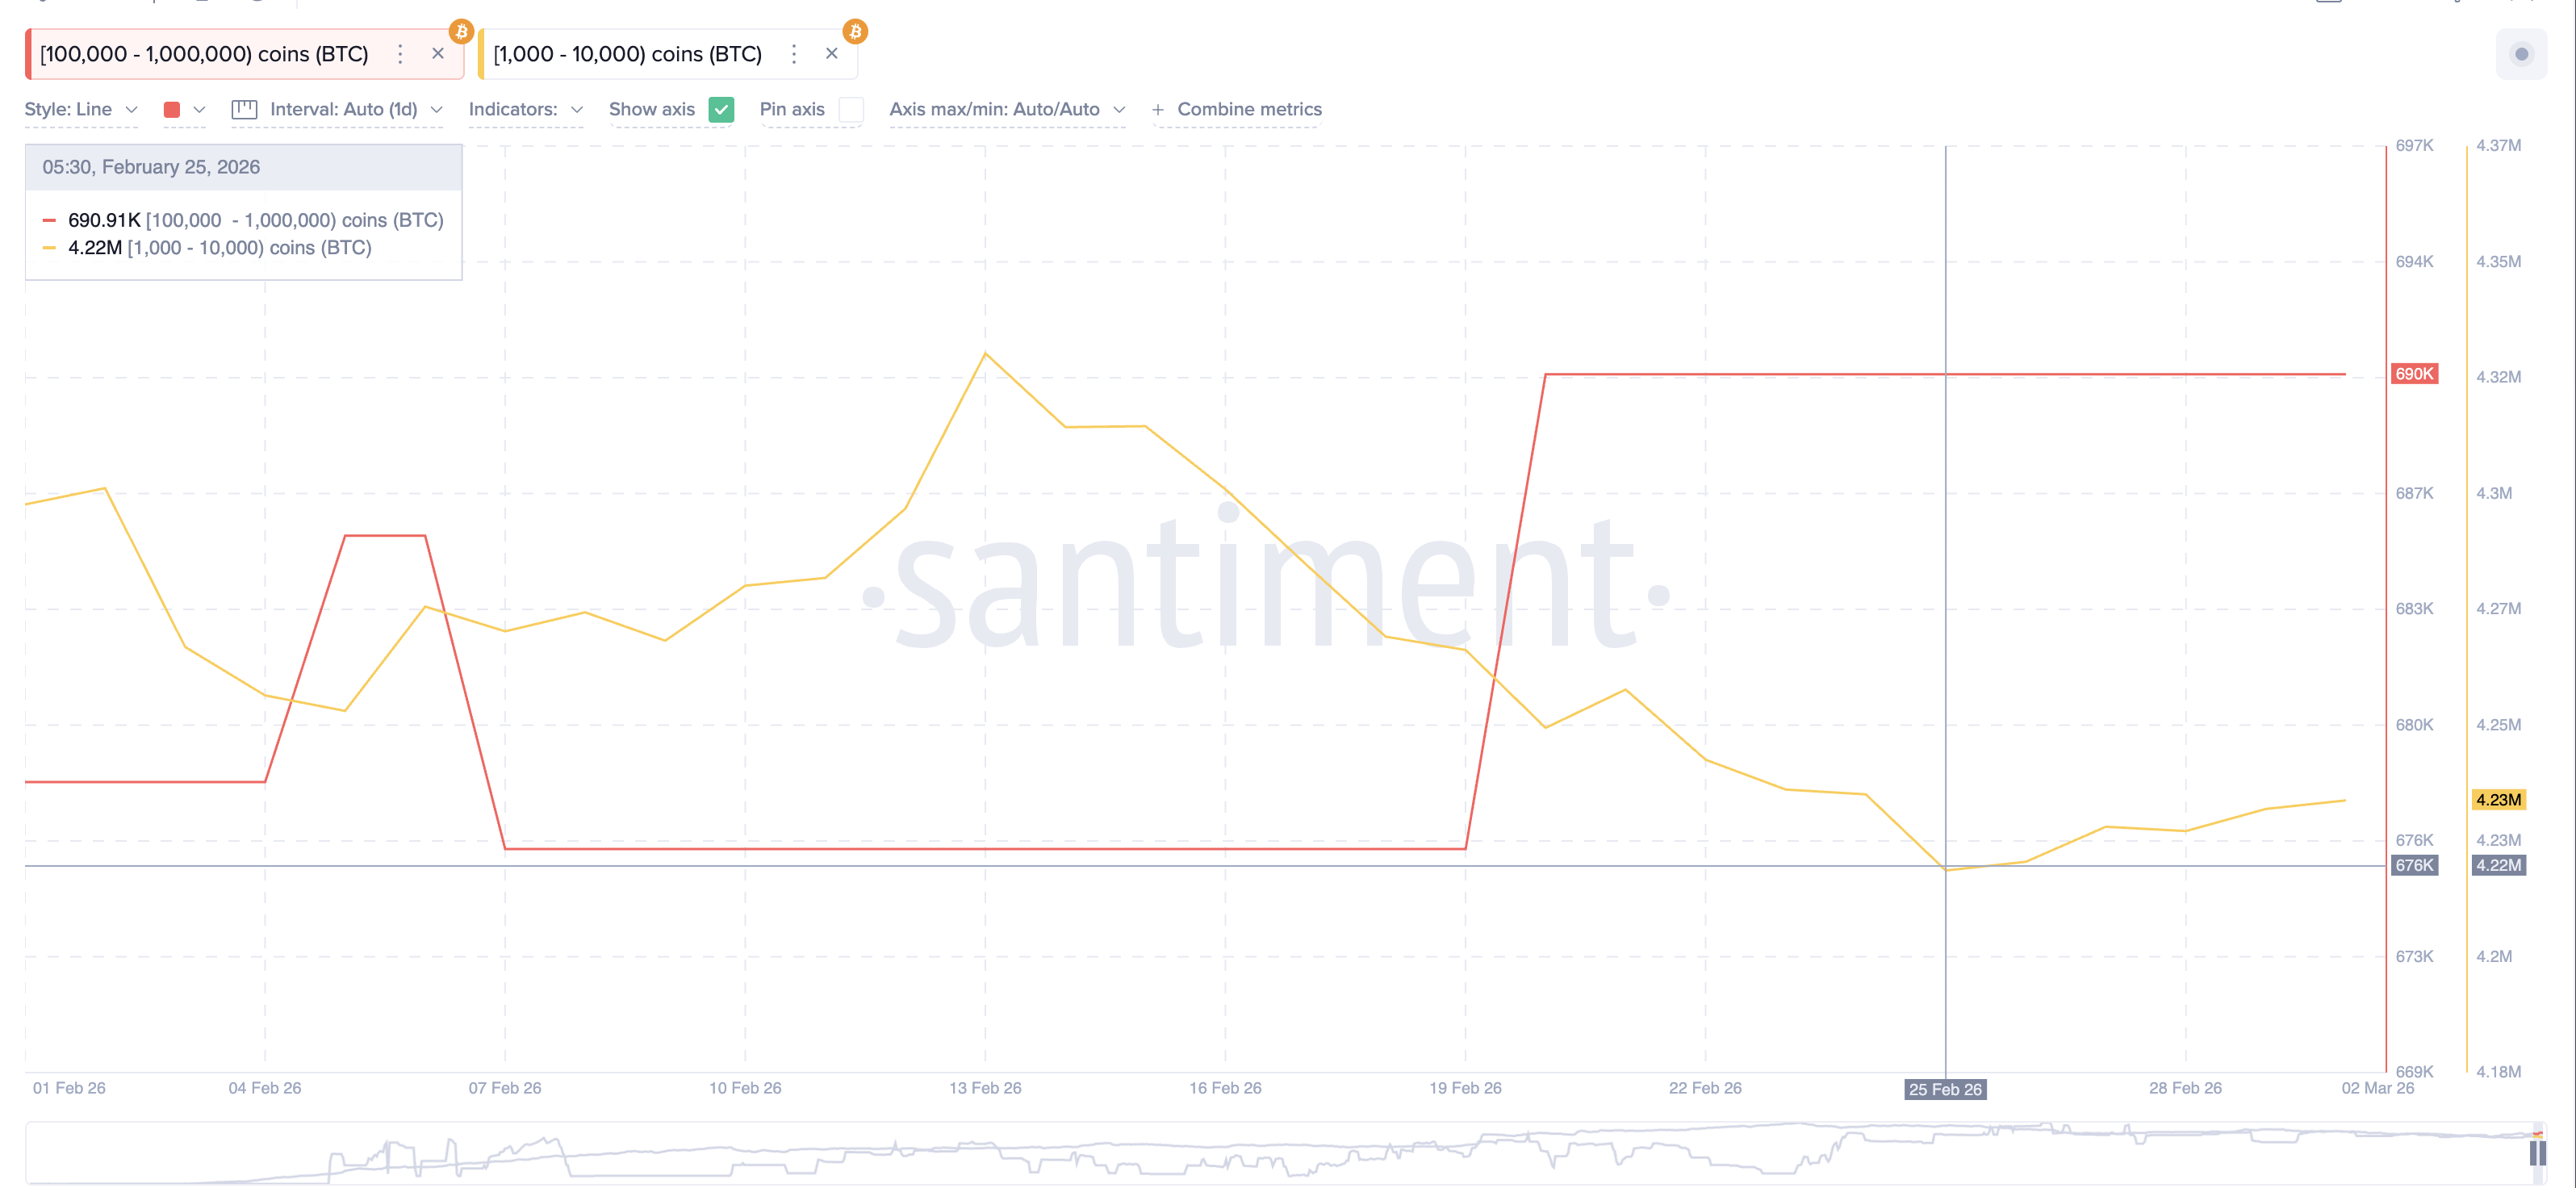
While selling weakens, buying is quietly picking up among whale cohorts. Wallets holding between 100,000 and 1,000,000 BTC increased their holdings from 676,540 to 690,000 BTC around February 19–20, during a brief 4.06% price rebound. Crucially, they have not sold since.
Meanwhile, smaller whales holding between 1,000 and 10,000 BTC began accumulating from February 25, with holdings rising from 4.222 million to 4.23 million BTC.
Why are whales holding?
One likely reason is the 20-day Simple Moving Average (SMA), a short-term trend indicator that smooths prices over 20 days. The Bitcoin price currently trades just below the 20-day SMA at $67,100. The last time this level was decisively crossed — on January 1 — Bitcoin rallied by over 12%. Whales appear to be positioning for a similar breakout.
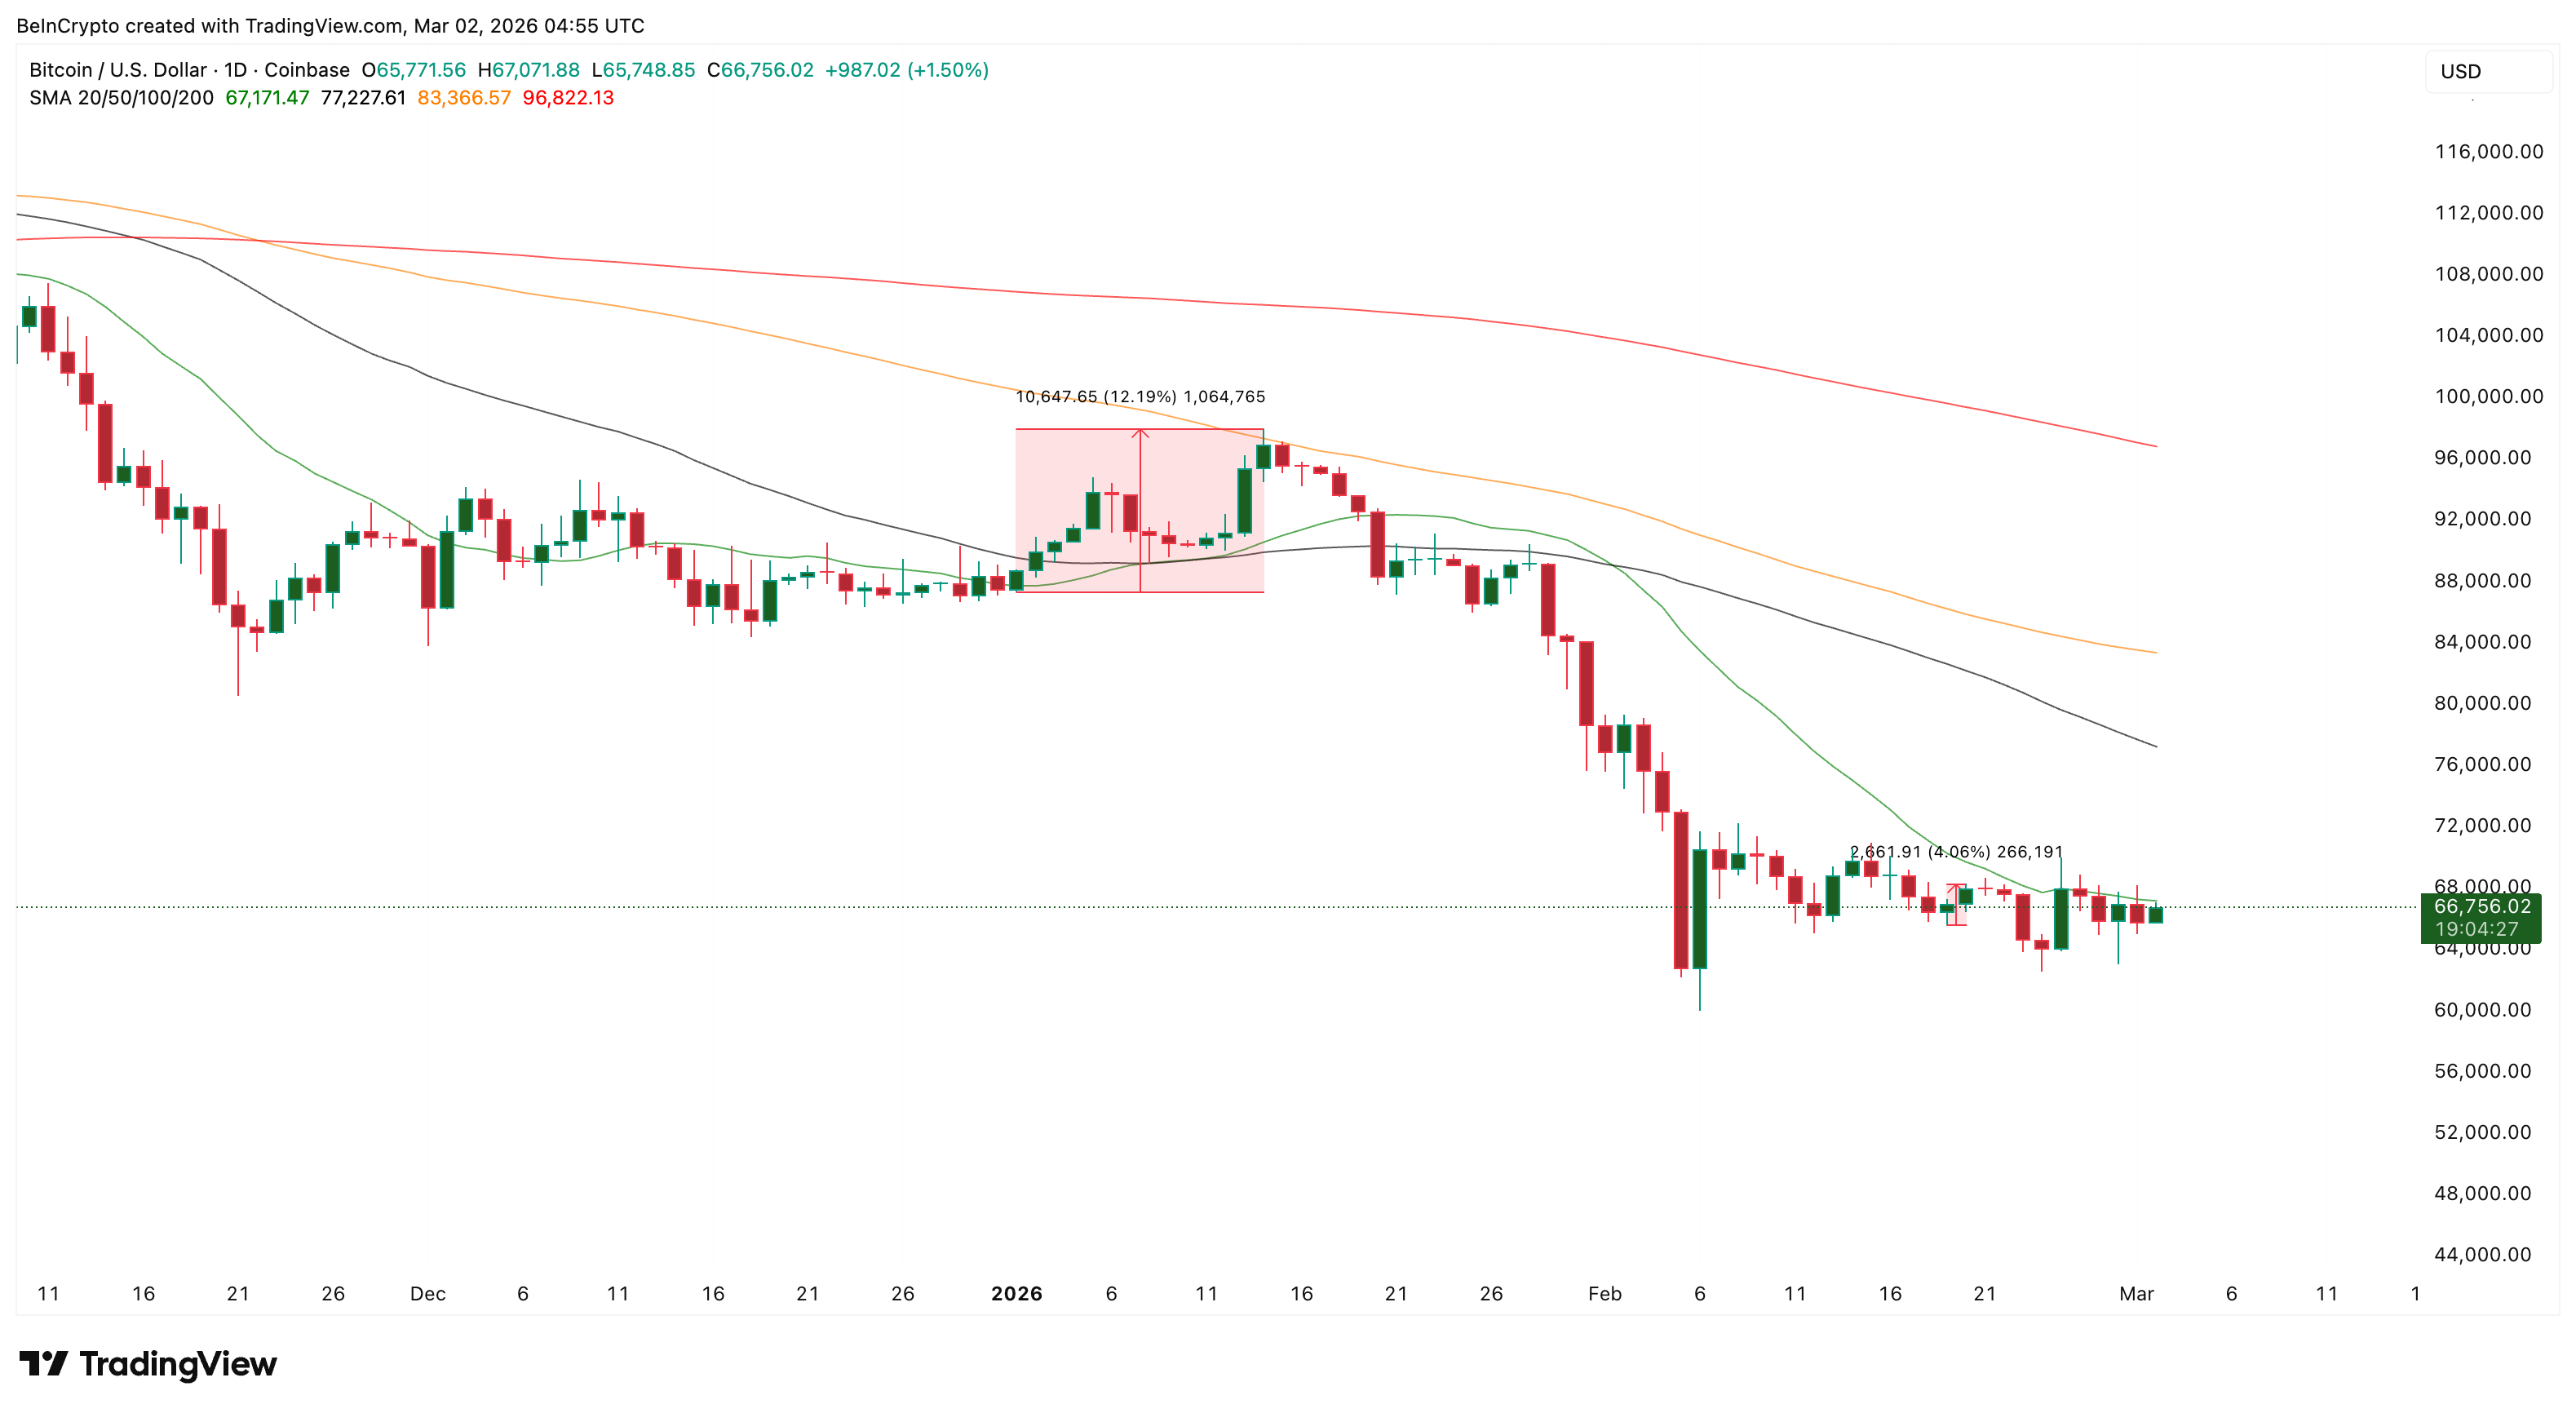
However, the long-term picture requires more conviction. The 50-day SMA sits at $77,200, and the 200-day SMA — the level that could genuinely confirm a bullish reversal — is far above at $96,800.
Han Tan from Bybit highlighted the importance of one such level:
“To the upside, Bitcoin may have to resurface above its 50-day SMA and reclaim the psychological $80k handle before more buyers are enticed back into the fold,” he added.
Bear Flag Threatens Bitcoin Price, but Invalidation Is in Play
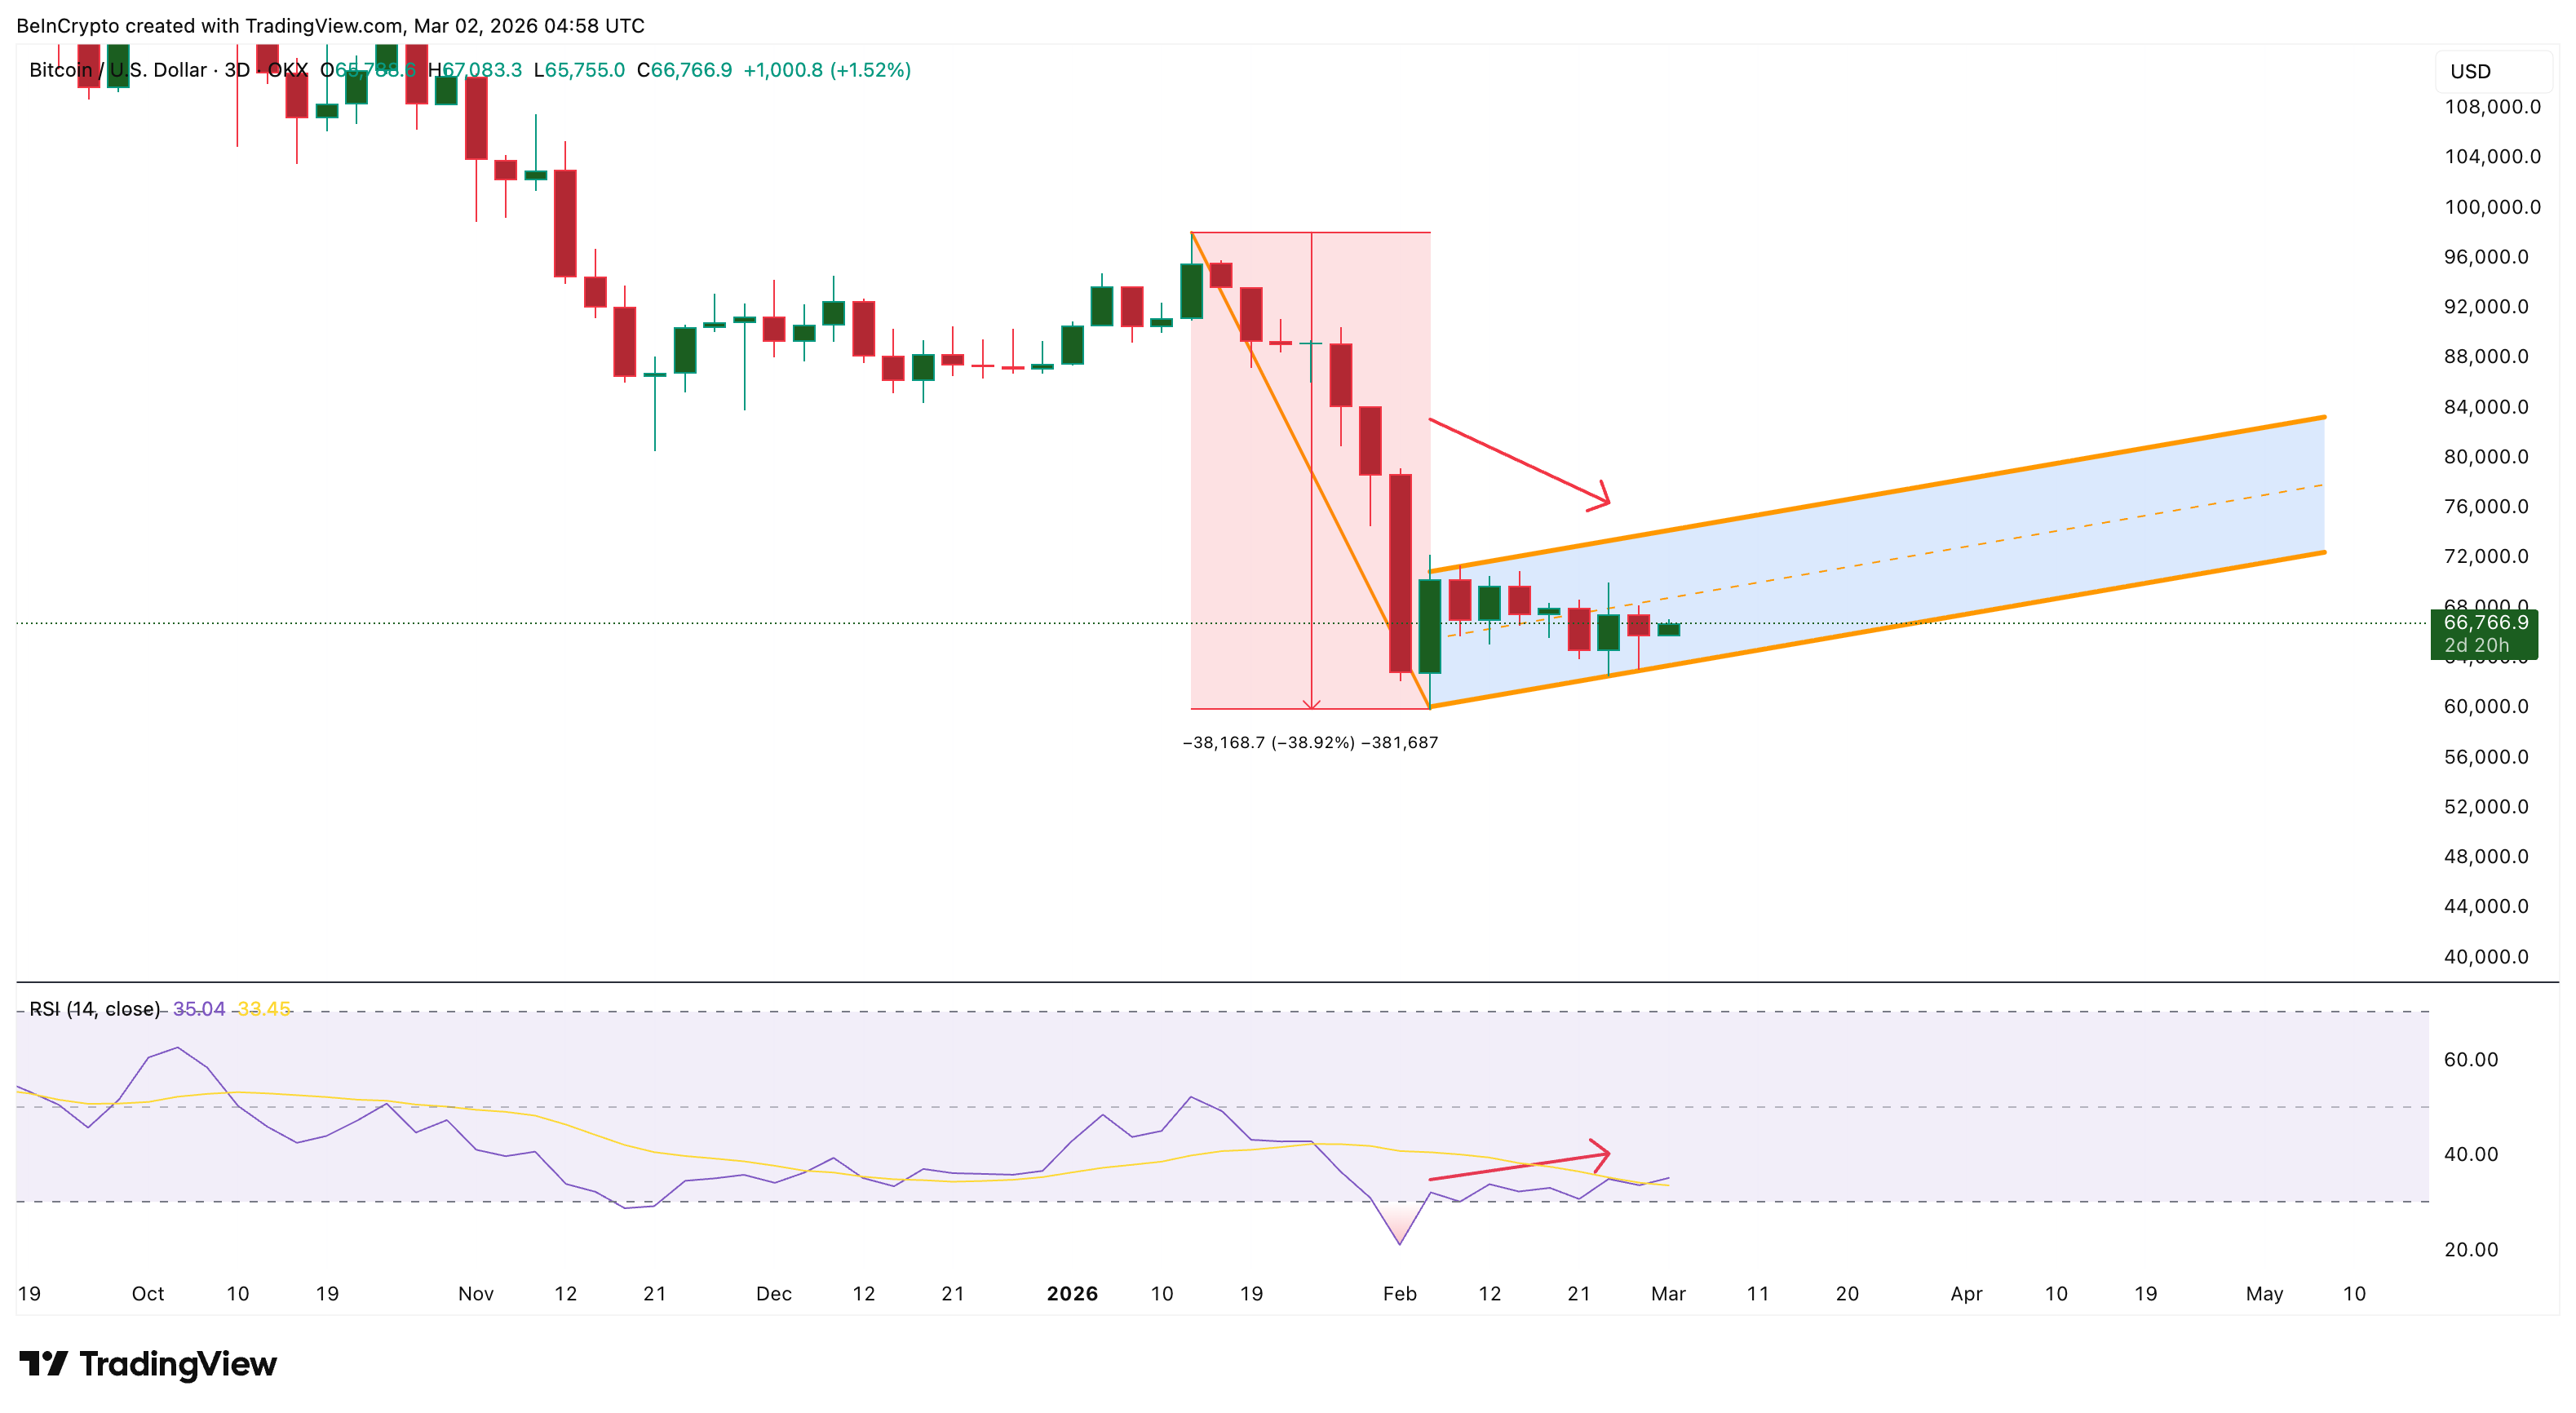
On the three-day chart, the Bitcoin price trades inside a bear flag, a bearish continuation pattern where price consolidates upward within parallel trendlines after a sharp drop. The flagpole measures a roughly 39% decline, meaning a confirmed breakdown could project a similar move lower.
Adding weight to this, a hidden bearish divergence has formed on the Relative Strength Index (RSI), a momentum oscillator. Between February 6 and February 24, the Bitcoin price printed a lower high while RSI printed a higher high. This mismatch suggests that despite the bounce, underlying momentum still favors the downside.
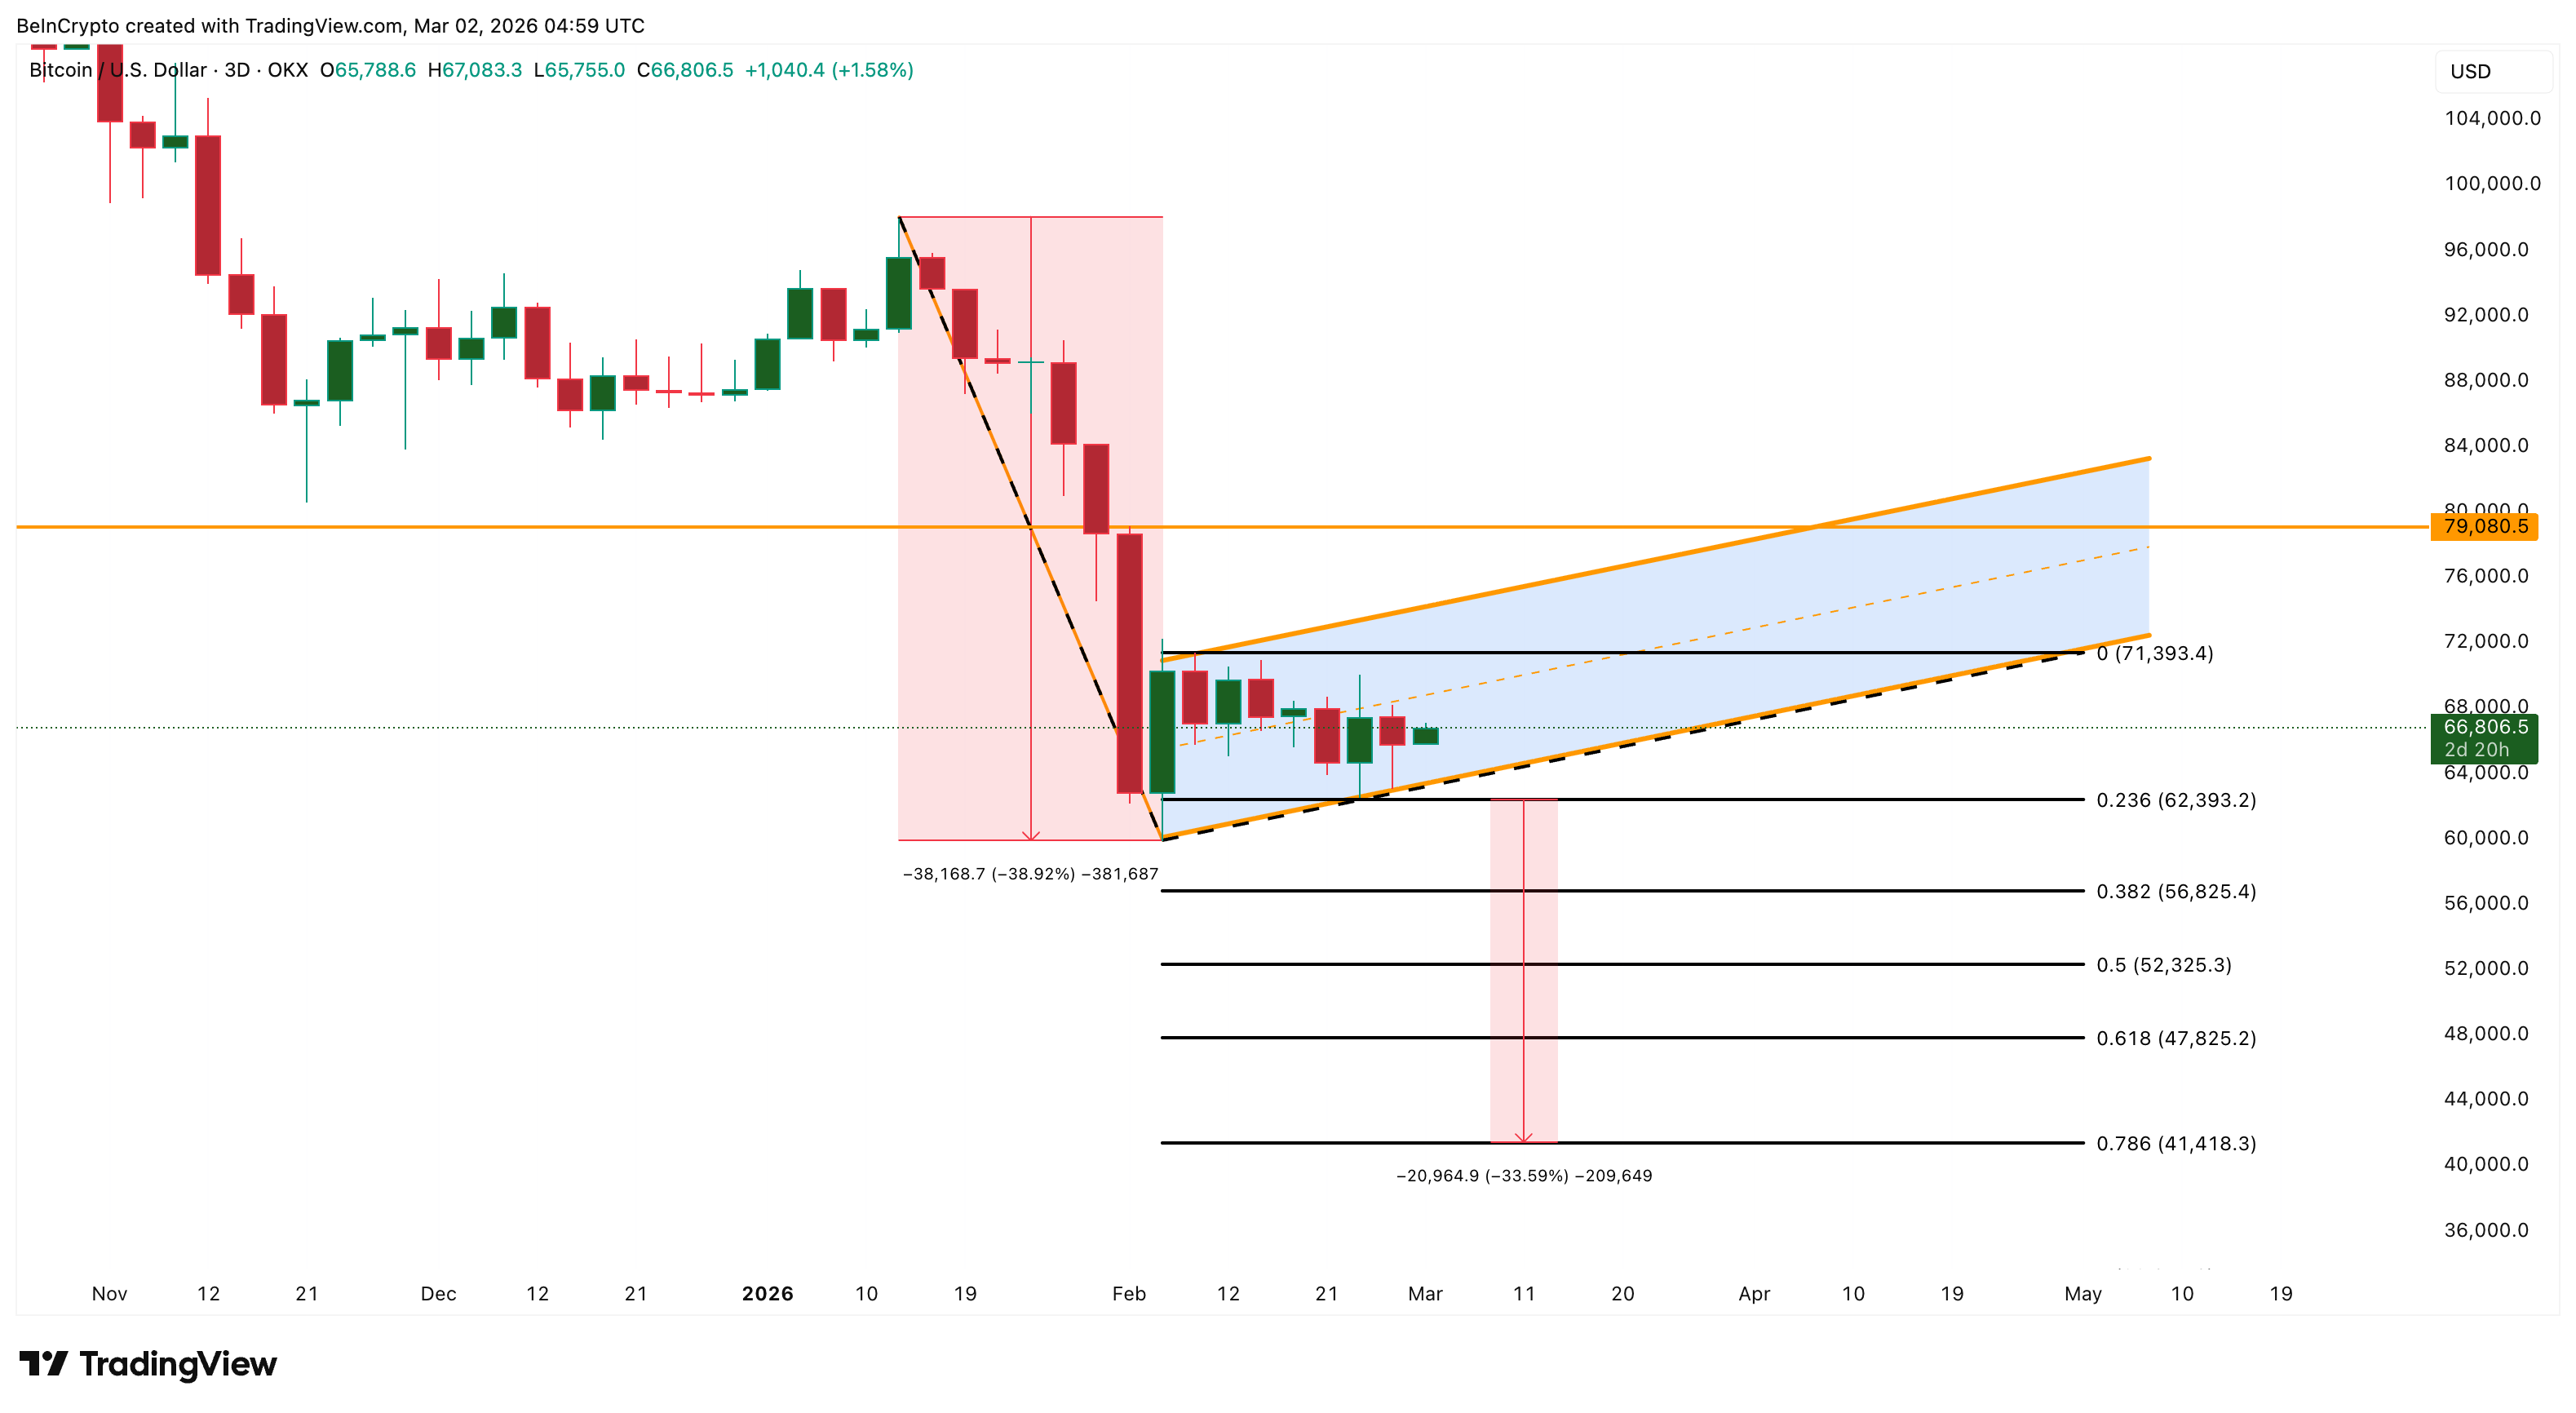
The key levels are clear. On the upside, $71,300 is the first significant resistance. A move above $79,000 would invalidate the bear flag. However, continued BTC price bounces can also shift the structure toward a rising channel, which would become bullish. The next few 3-day candles would therefore determine if the flag breaks or the extension invalidates the bearish pole-and-flag rule.
On the downside, a breakdown below $62,300 opens the door to Fibonacci support levels at $56,800, $52,300, $47,800, and, in extreme scenarios, $41,400.
Crowther sees the most probable outcome as relatively contained, highlighting the chance of a mild bounce.
“Flat, or slightly positive price movement throughout March should be an investor’s base case scenario for now,” he said.
Kılıç, however, pushed back on the bearish framing, aligning with the on-chain selling exhaustion and bounce hopes:
“Extreme fear and the deepest ETF outflow streak in a year aren’t bearish signals. I’d actually define them as classic capitulation, flushing out weak hands and tightening supply,” he stated.
The most likely path for March, therefore, involves a local bounce — driven by exhausting sell pressure and whale accumulation — followed by renewed selling as the broader bear flag structure resolves. Selling is weakening, but it hasn’t been extinguished. A local bottom is not the same as a cycle bottom. March will likely be defined by whether $62,300 support holds or $79,000 resistance breaks first.