BitMine Stock Risks 40% Drop — Tom Lee’s Strategy to Blame?

BitMine Immersion Technologies is entering a high-risk phase as paper losses on its Ethereum holdings continue to deepen. The stock has failed to hold recent rebounds, while both technical and crypto-linked signals point to weakening conviction.
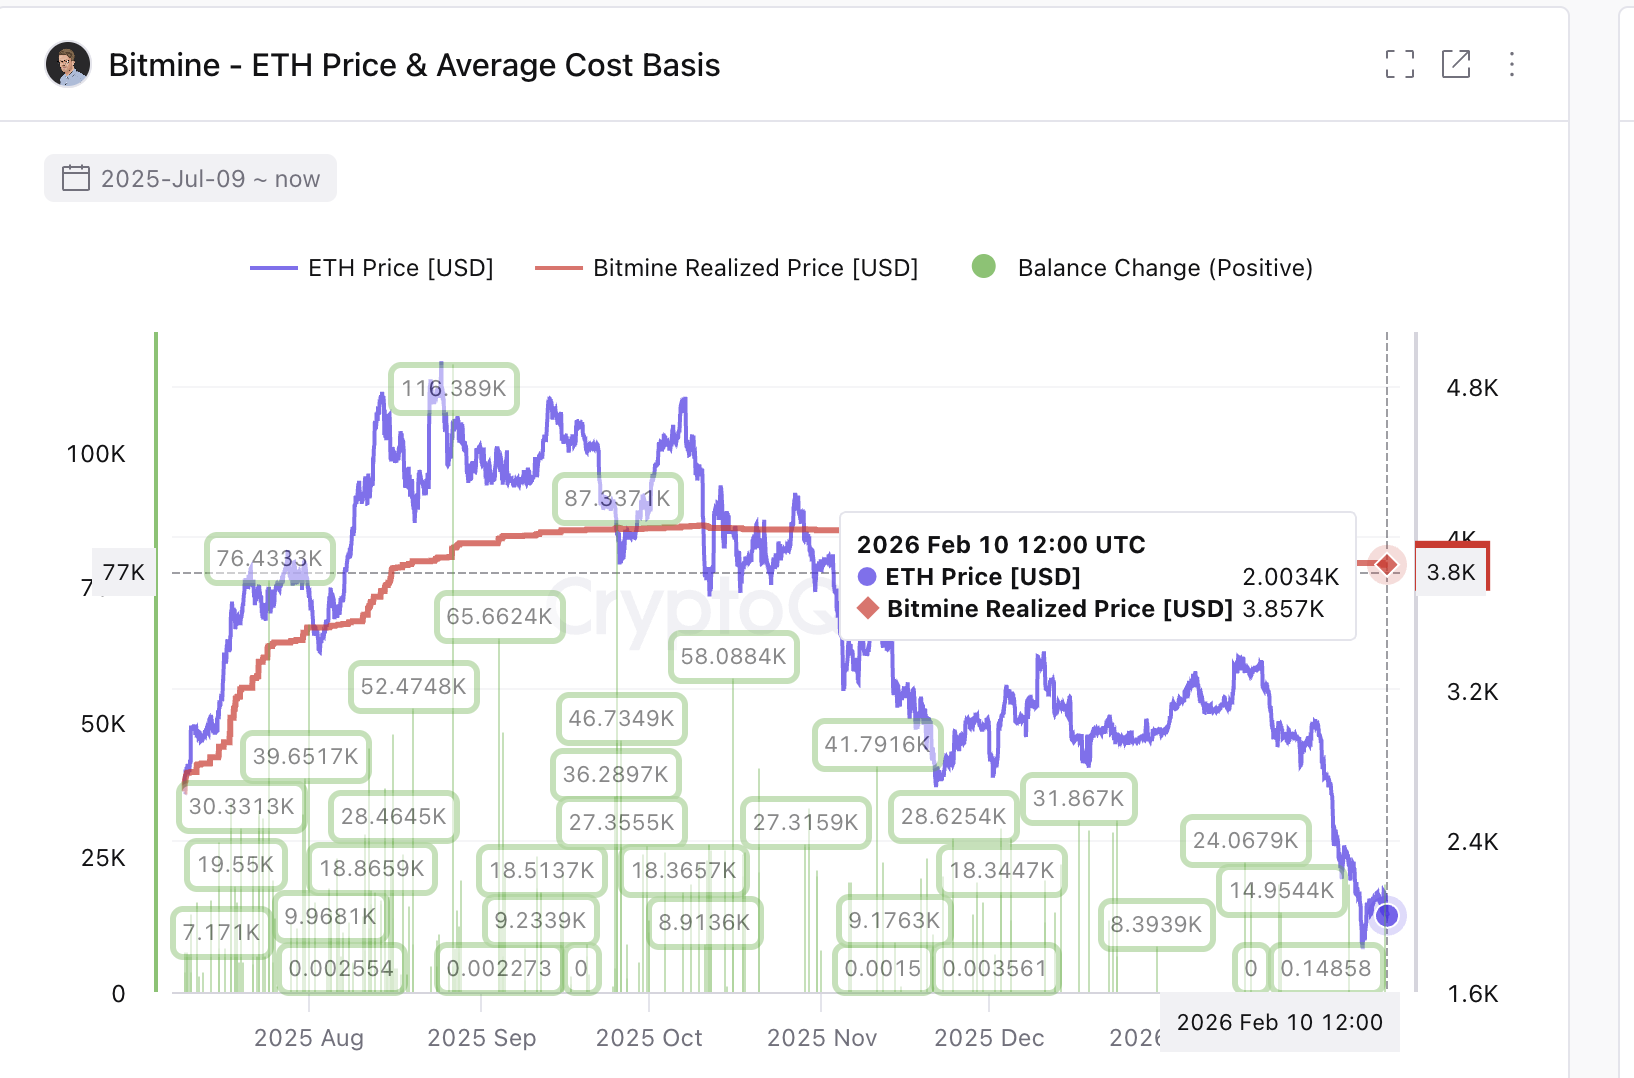
As of February 10, BitMine’s total invested capital stood at nearly $15 billion. Its current portfolio value has dropped to about $7.7 billion.
This means nearly 49% of its investment value has been wiped out, on paper. At the same time, Ethereum trades near $1,950, while BitMine’s realized cost basis sits around $3,850. With ETH priced almost 50% below the average buy level, most holdings remain deeply underwater.
Sponsored
Sponsored
Cost-Basis Losses and Hidden Divergence Signal Rising Sell Pressure
BitMine’s biggest weakness is its shrinking margin of safety.
The realized price shows where the company accumulated most of its Ethereum. When the market price stays far below this level, companies are under pressure to cut exposure.
Want more token insights like this? Sign up for Editor Harsh Notariya’s Daily Crypto Newsletter here.
Current data shows:
Average ETH cost basis: $3,850
Current ETH price: $1,950
Unrealized loss: 49%
This puts BitMine in a vulnerable position. Technical signals reinforce this risk.
Sponsored
Sponsored
Between November 18 and February 9, BMNR formed lower highs on the daily chart, while the Relative Strength Index made higher highs. RSI tracks momentum by measuring buying and selling strength. When price makes lower highs, and RSI makes higher highs, it forms a hidden bearish divergence. This shows weakening momentum beneath the surface.
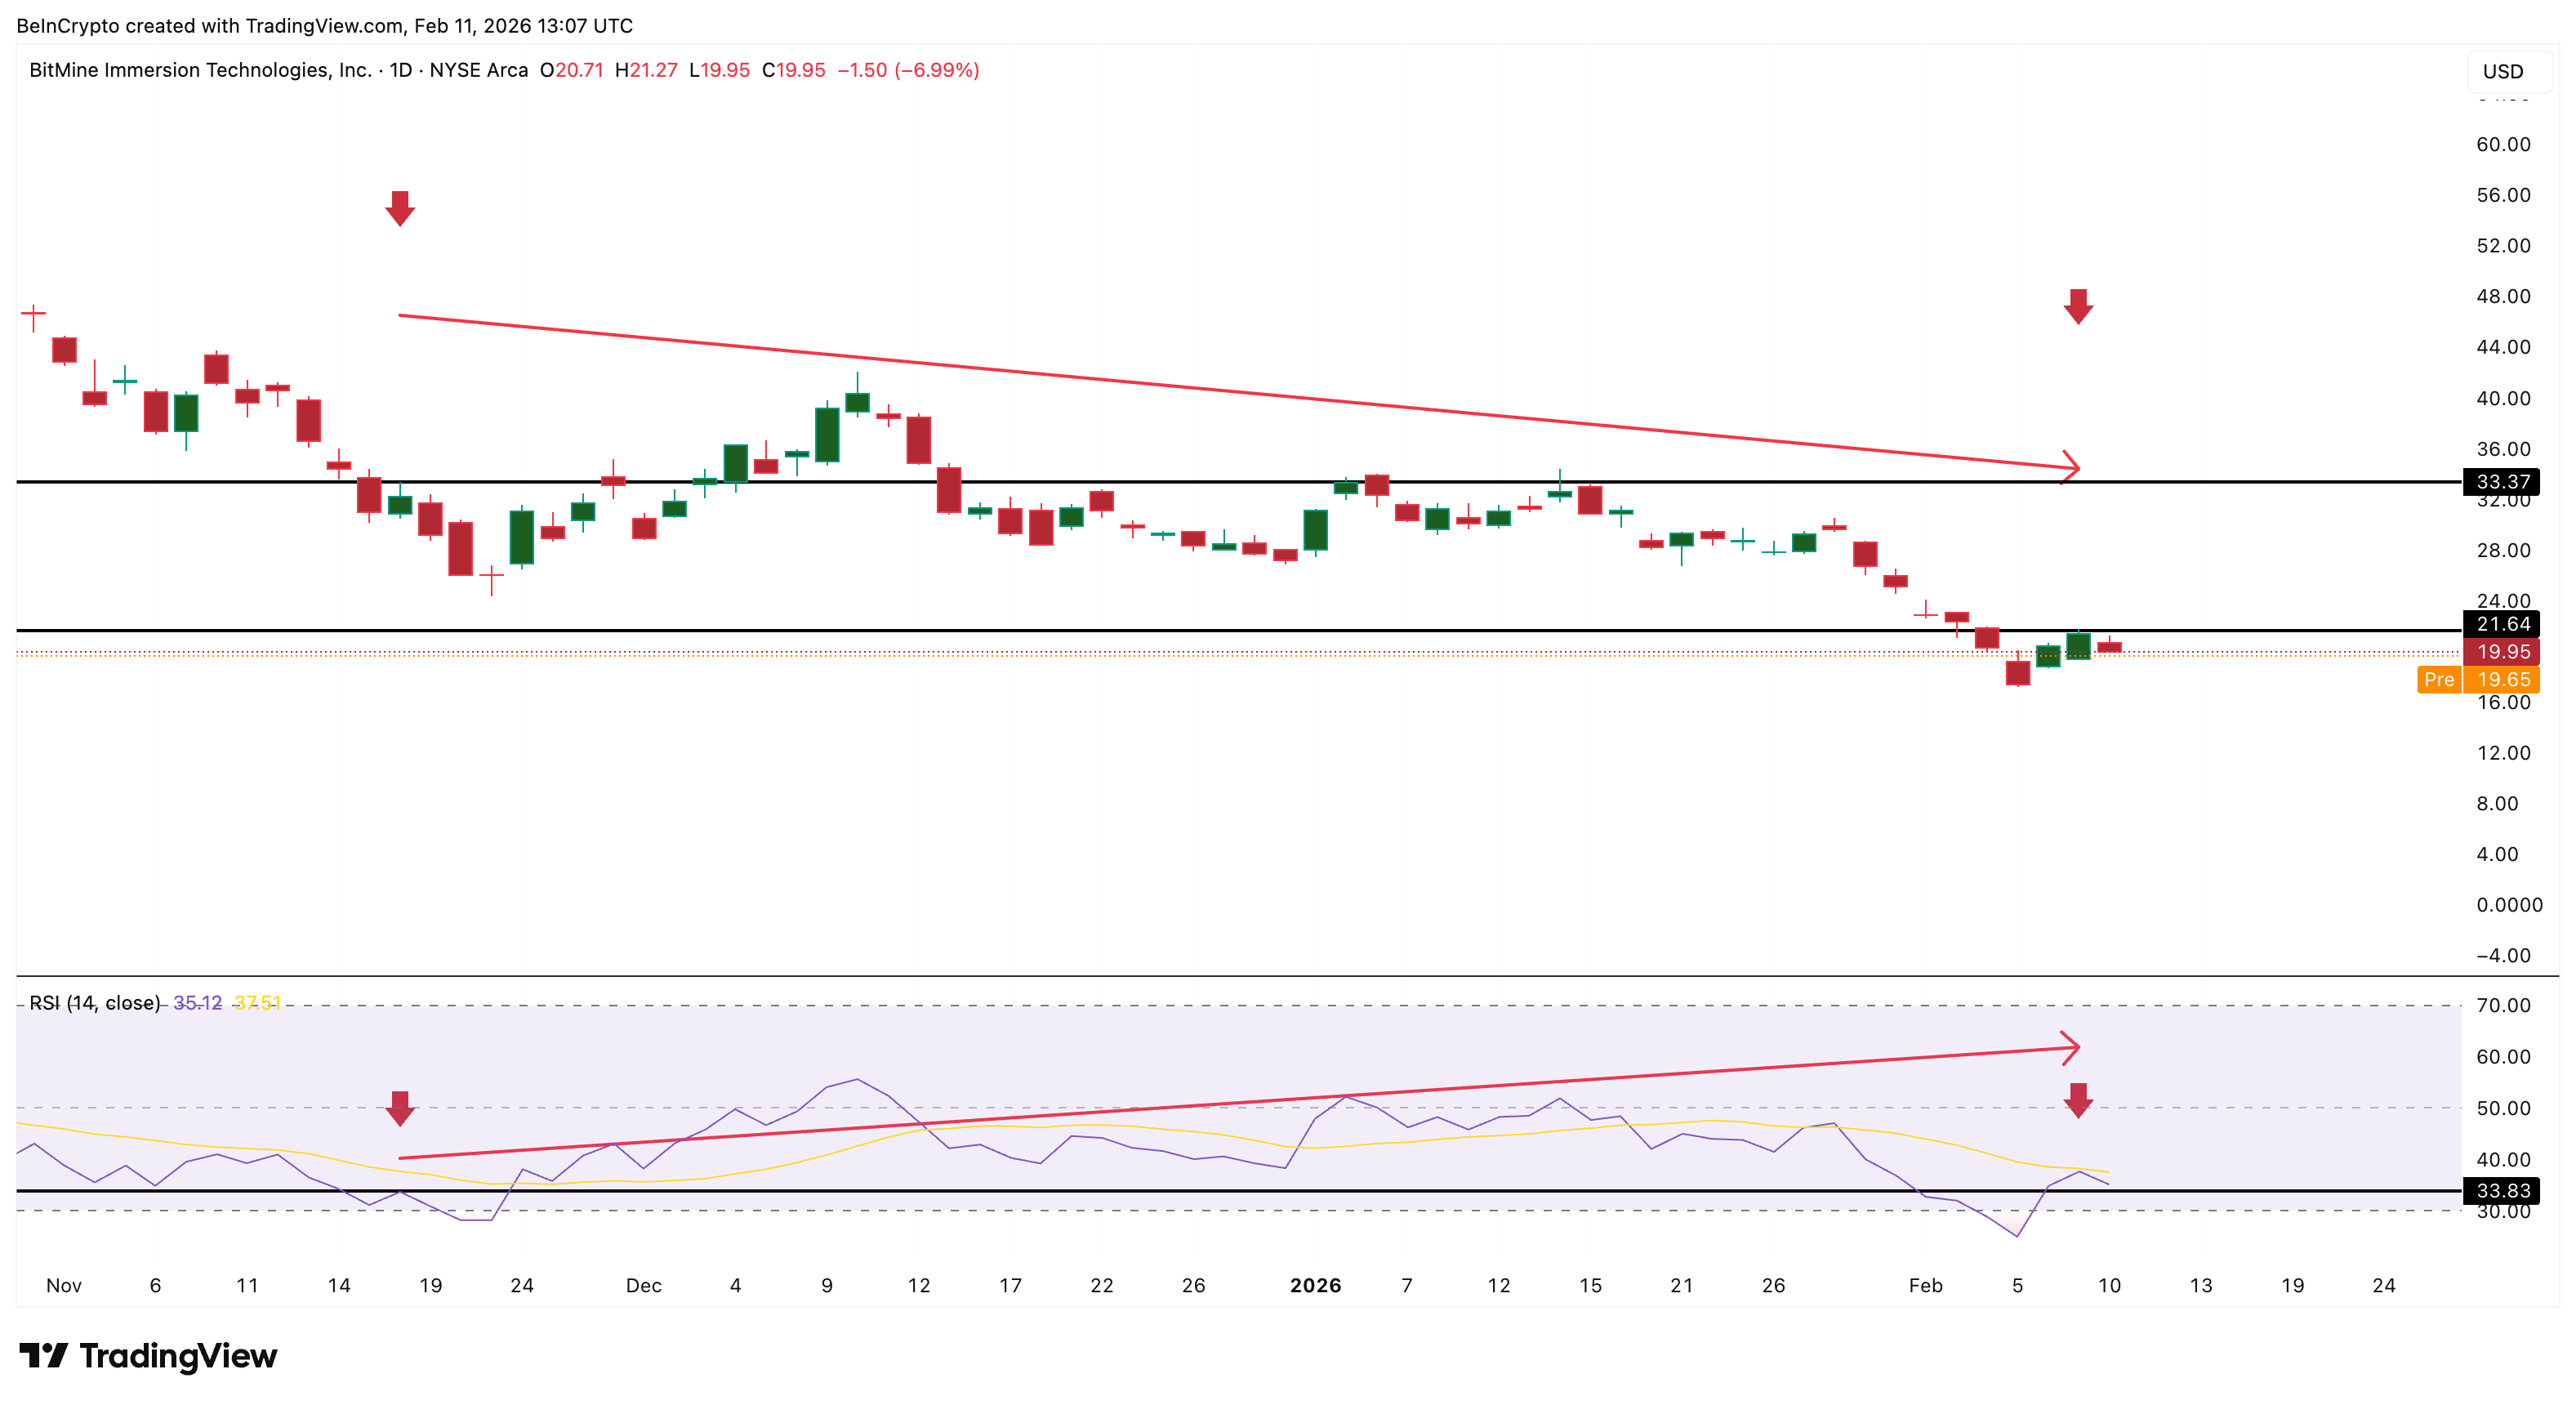
Soon after this divergence appeared, selling resumed. BMNR had rebounded nearly 26% from January lows. But the rally failed to hold and is now at risk of a pullback, led by divergence and rising cost-basis pressure.
Weak Money Flow and Crossover Risk Show Fading Confidence
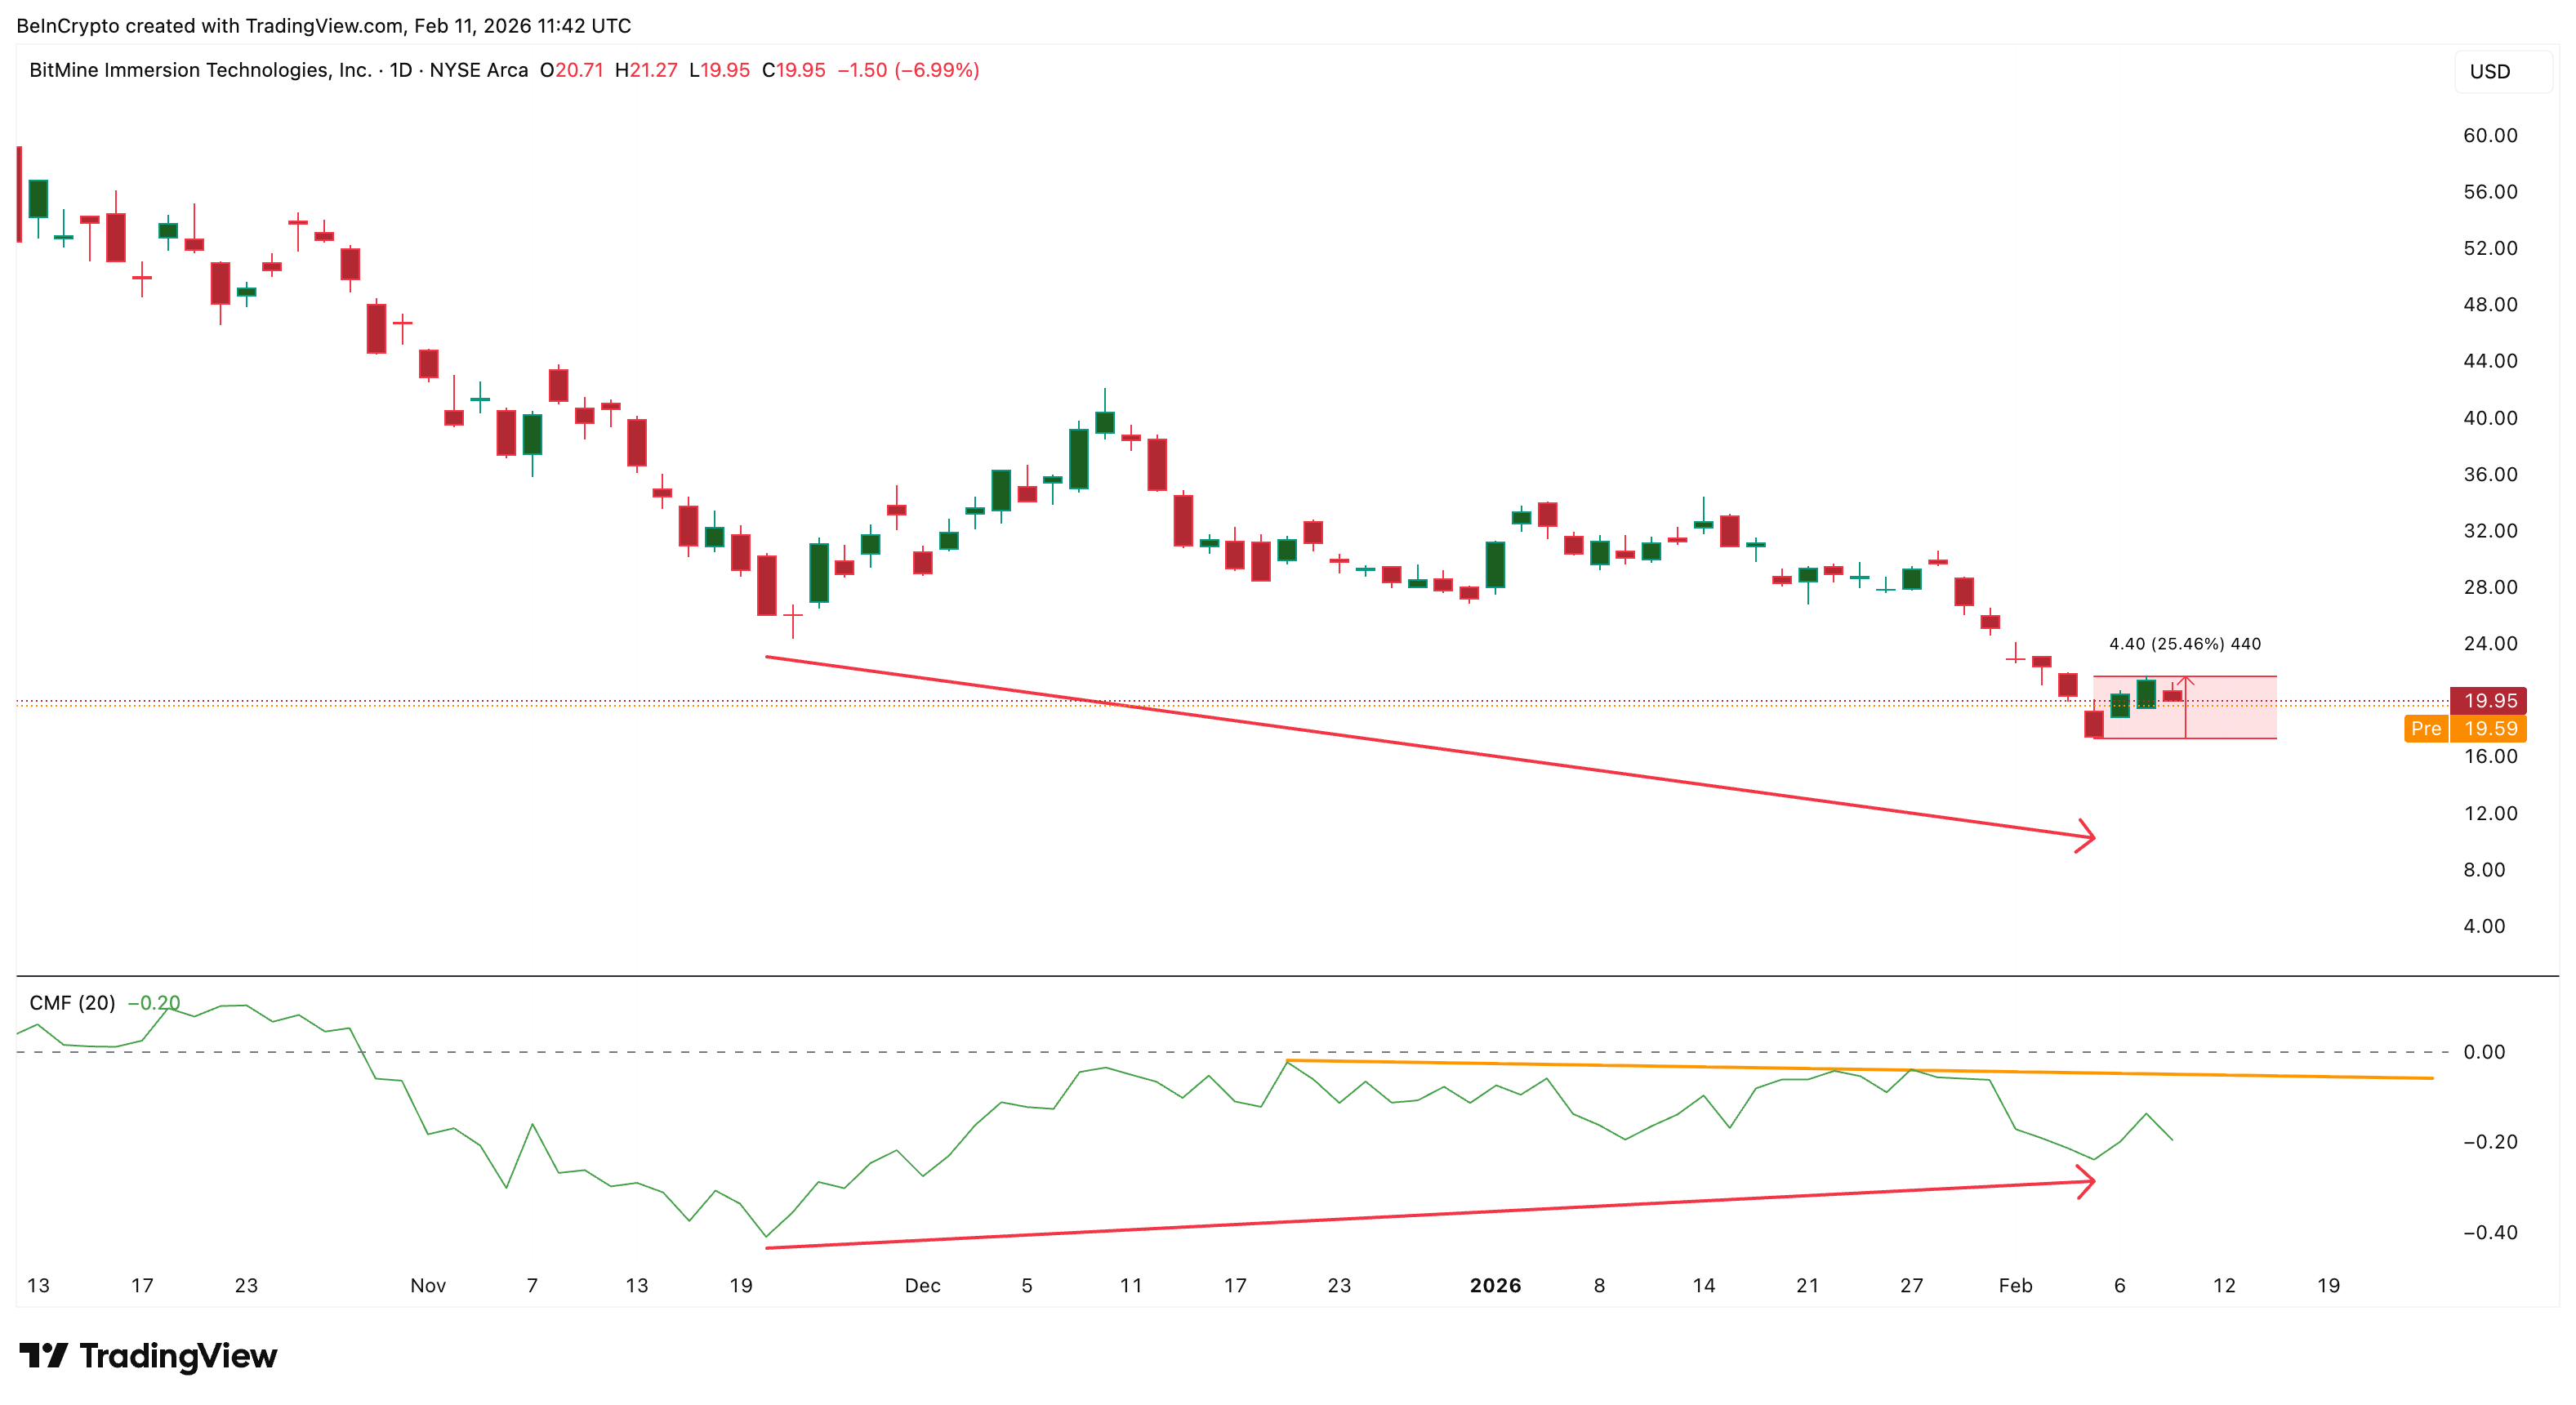
Big money shows early signs of hesitation. Chaikin Money Flow, or CMF, tracks whether large investors are accumulating or distributing. Values above zero usually signal buying. Values below zero suggest selling pressure.
Between late November and early February, CMF trended up despite falling prices. This showed some long-term support, which remains. But even during the recent 26% rebound, CMF failed to break above its falling trendline. It also failed to make new highs and even go above the zero line. This means the rally lacked strong backing from big wallets, and the current trend still leans toward big-money exits.
Sponsored
Sponsored
Moving averages add another warning. The 100-day Exponential Moving Average (EMA) is now approaching the 200-day EMA. An Exponential Moving Average (EMA) gives more weight to recent prices, making it useful for spotting early trend shifts.
When shorter-term averages move below longer ones, it often signals deeper weakness. Earlier, on January 27, a bearish (death) crossover occurred when the 50-day EMA fell below the 200-day EMA. After that signal, BMNR dropped over 44%.
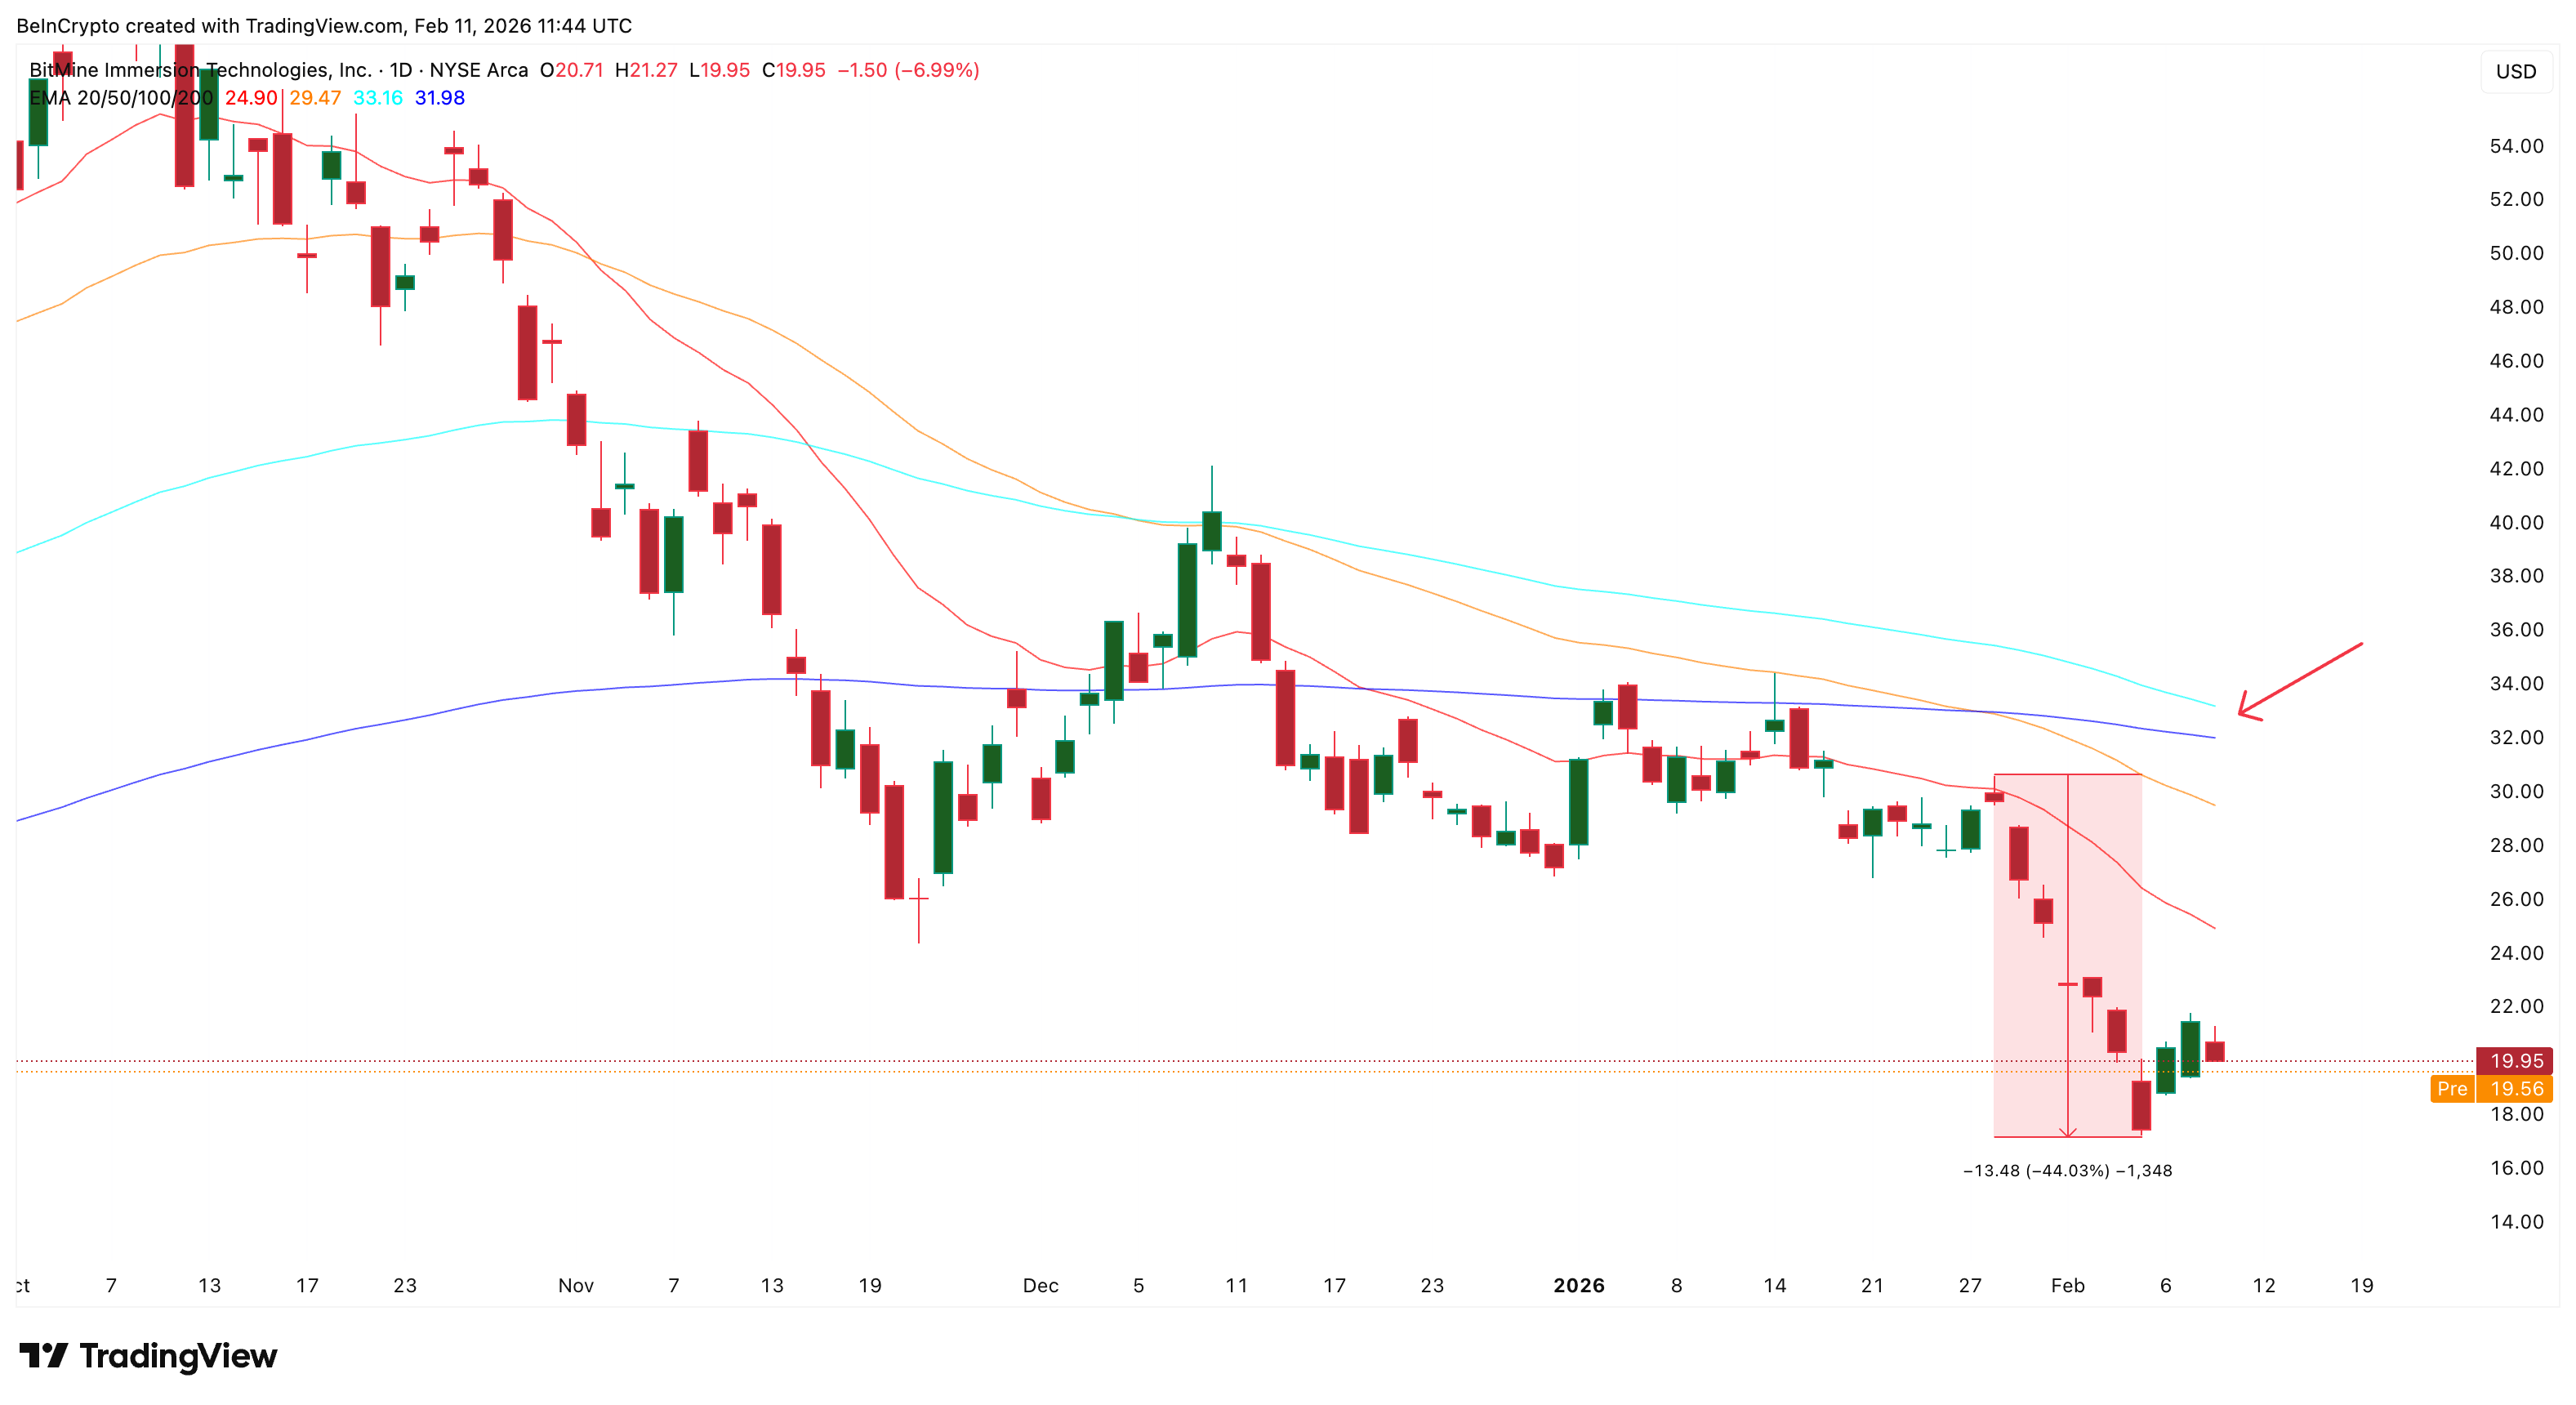
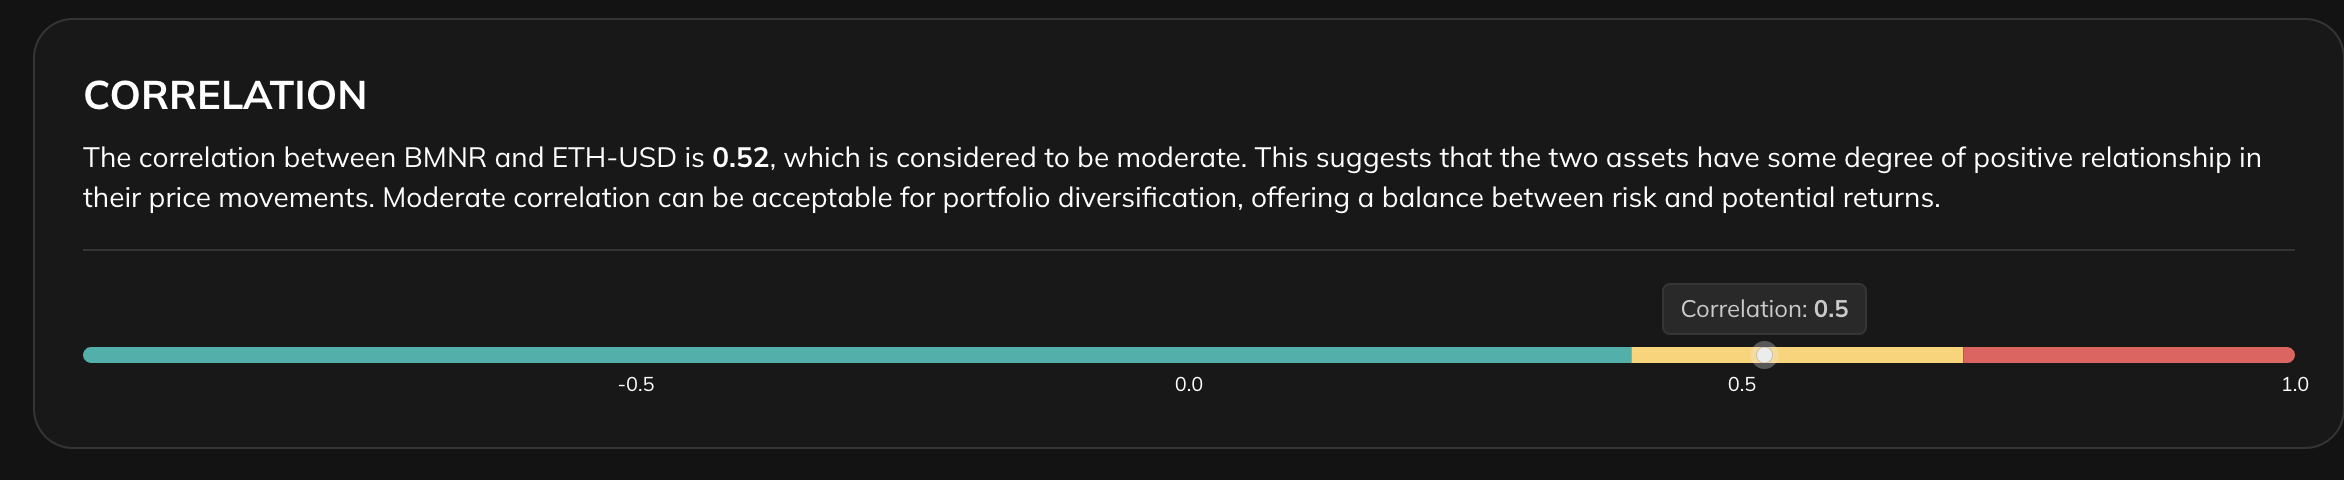
If another bearish crossover forms, downside pressure could accelerate, even if it isn’t as impactful as the death crossover. This risk increases if Ethereum remains weak. BMNR still shows moderate correlation with ETH near 0.5.
Sponsored
Sponsored
Continued ETH weakness could directly weigh on the stock.
Key BitMine Stock Levels Show Where the Next Breakdown Could Begin
With cost-basis losses growing, the BitMine stock price structure now becomes critical. The most important short-term support sits near $17, slightly over 10% from the current levels. This level has acted as a base during recent consolidation.
If BMNR loses $17, downside momentum could increase sharply.
Below this zone, the next support appears near $15. If that fails, Fibonacci projections point toward $11, which marks the 0.618 retracement level, a historically strong level. A move toward $11 would represent an additional downside of more than 40% from current levels.
On the upside, recovery remains difficult. The BitMine stock price must reclaim $21 to ease immediate pressure. This level aligns with prior resistance.
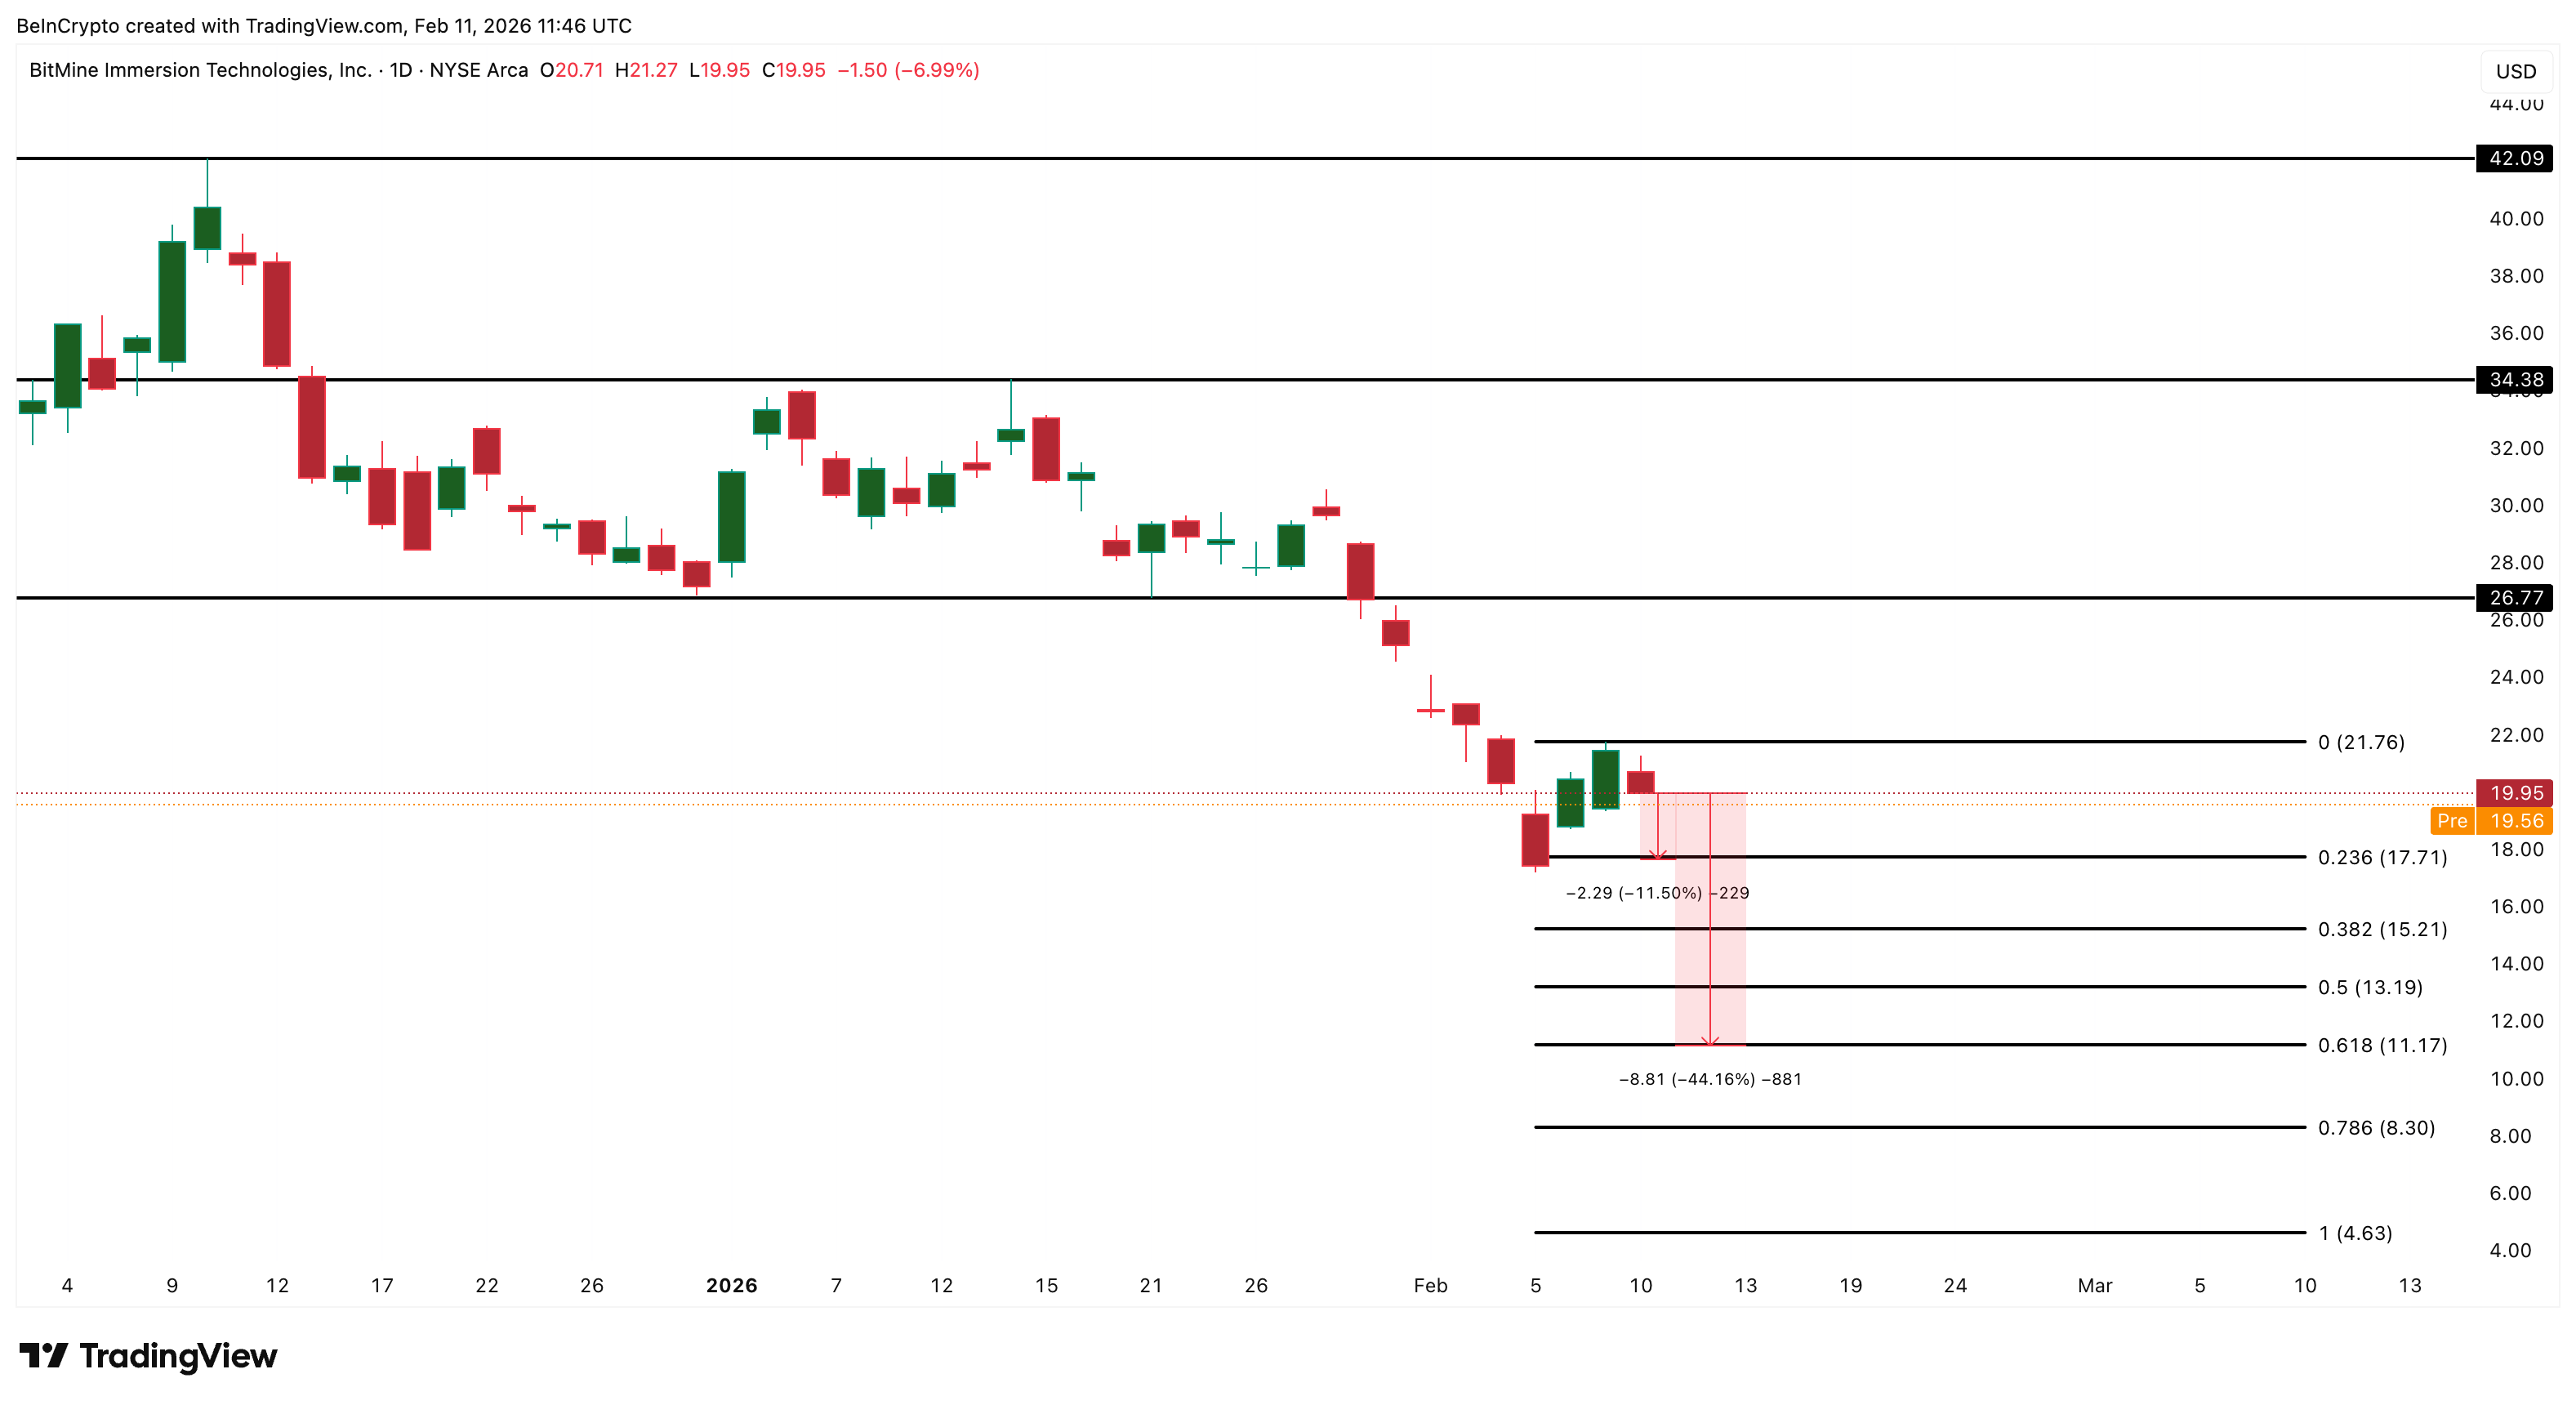
Only above $21 would the short-term structure begin to improve. A further move toward $26 would require stronger Ethereum prices and renewed big money demand. At present, both remain uncertain. As long as ETH trades far below BitMine’s cost basis and money flows weaken, rebounds are likely to face heavy selling.