MicroStrategy Stock Price at 10% Risk as Bitcoin Link Tightens

The MicroStrategy stock price closed around $133 on February 13, rising 8.85% in one day. The weekly gain reached nearly 5%, showing strength despite broader uncertainty. But this rally comes at a strange time. Bitcoin fell about 2.2% over the same period, creating a gap between the two assets that rarely lasts long.
New data shows that MicroStrategy and Bitcoin are moving almost identically again. The 7-day rolling correlation has surged to 0.98, near perfect alignment. This tight link means the MicroStrategy price prediction going forward in 2026 may depend heavily on Bitcoin’s next move. At the same time, momentum indicators and volume signals show early warning signs that the recent MSTR price bounce may face pressure.
Sponsored
Sponsored
MicroStrategy’s Bitcoin Correlation and RSI Signal Correction Risk
Rolling correlation measures how closely two assets move together over a set period. The current 7-day correlation of 0.98 means MicroStrategy and Bitcoin are moving in nearly the same direction. This is the highest level since early February. When correlation reaches this level, price moves in one asset often carry over to the other.
This creates a risk because Bitcoin has weakened recently while MicroStrategy stock moved higher. Such gaps often close when markets reopen, causing delayed corrections.
Want more token insights like this? Sign up for Editor Harsh Notariya’s Daily Crypto Newsletter here.
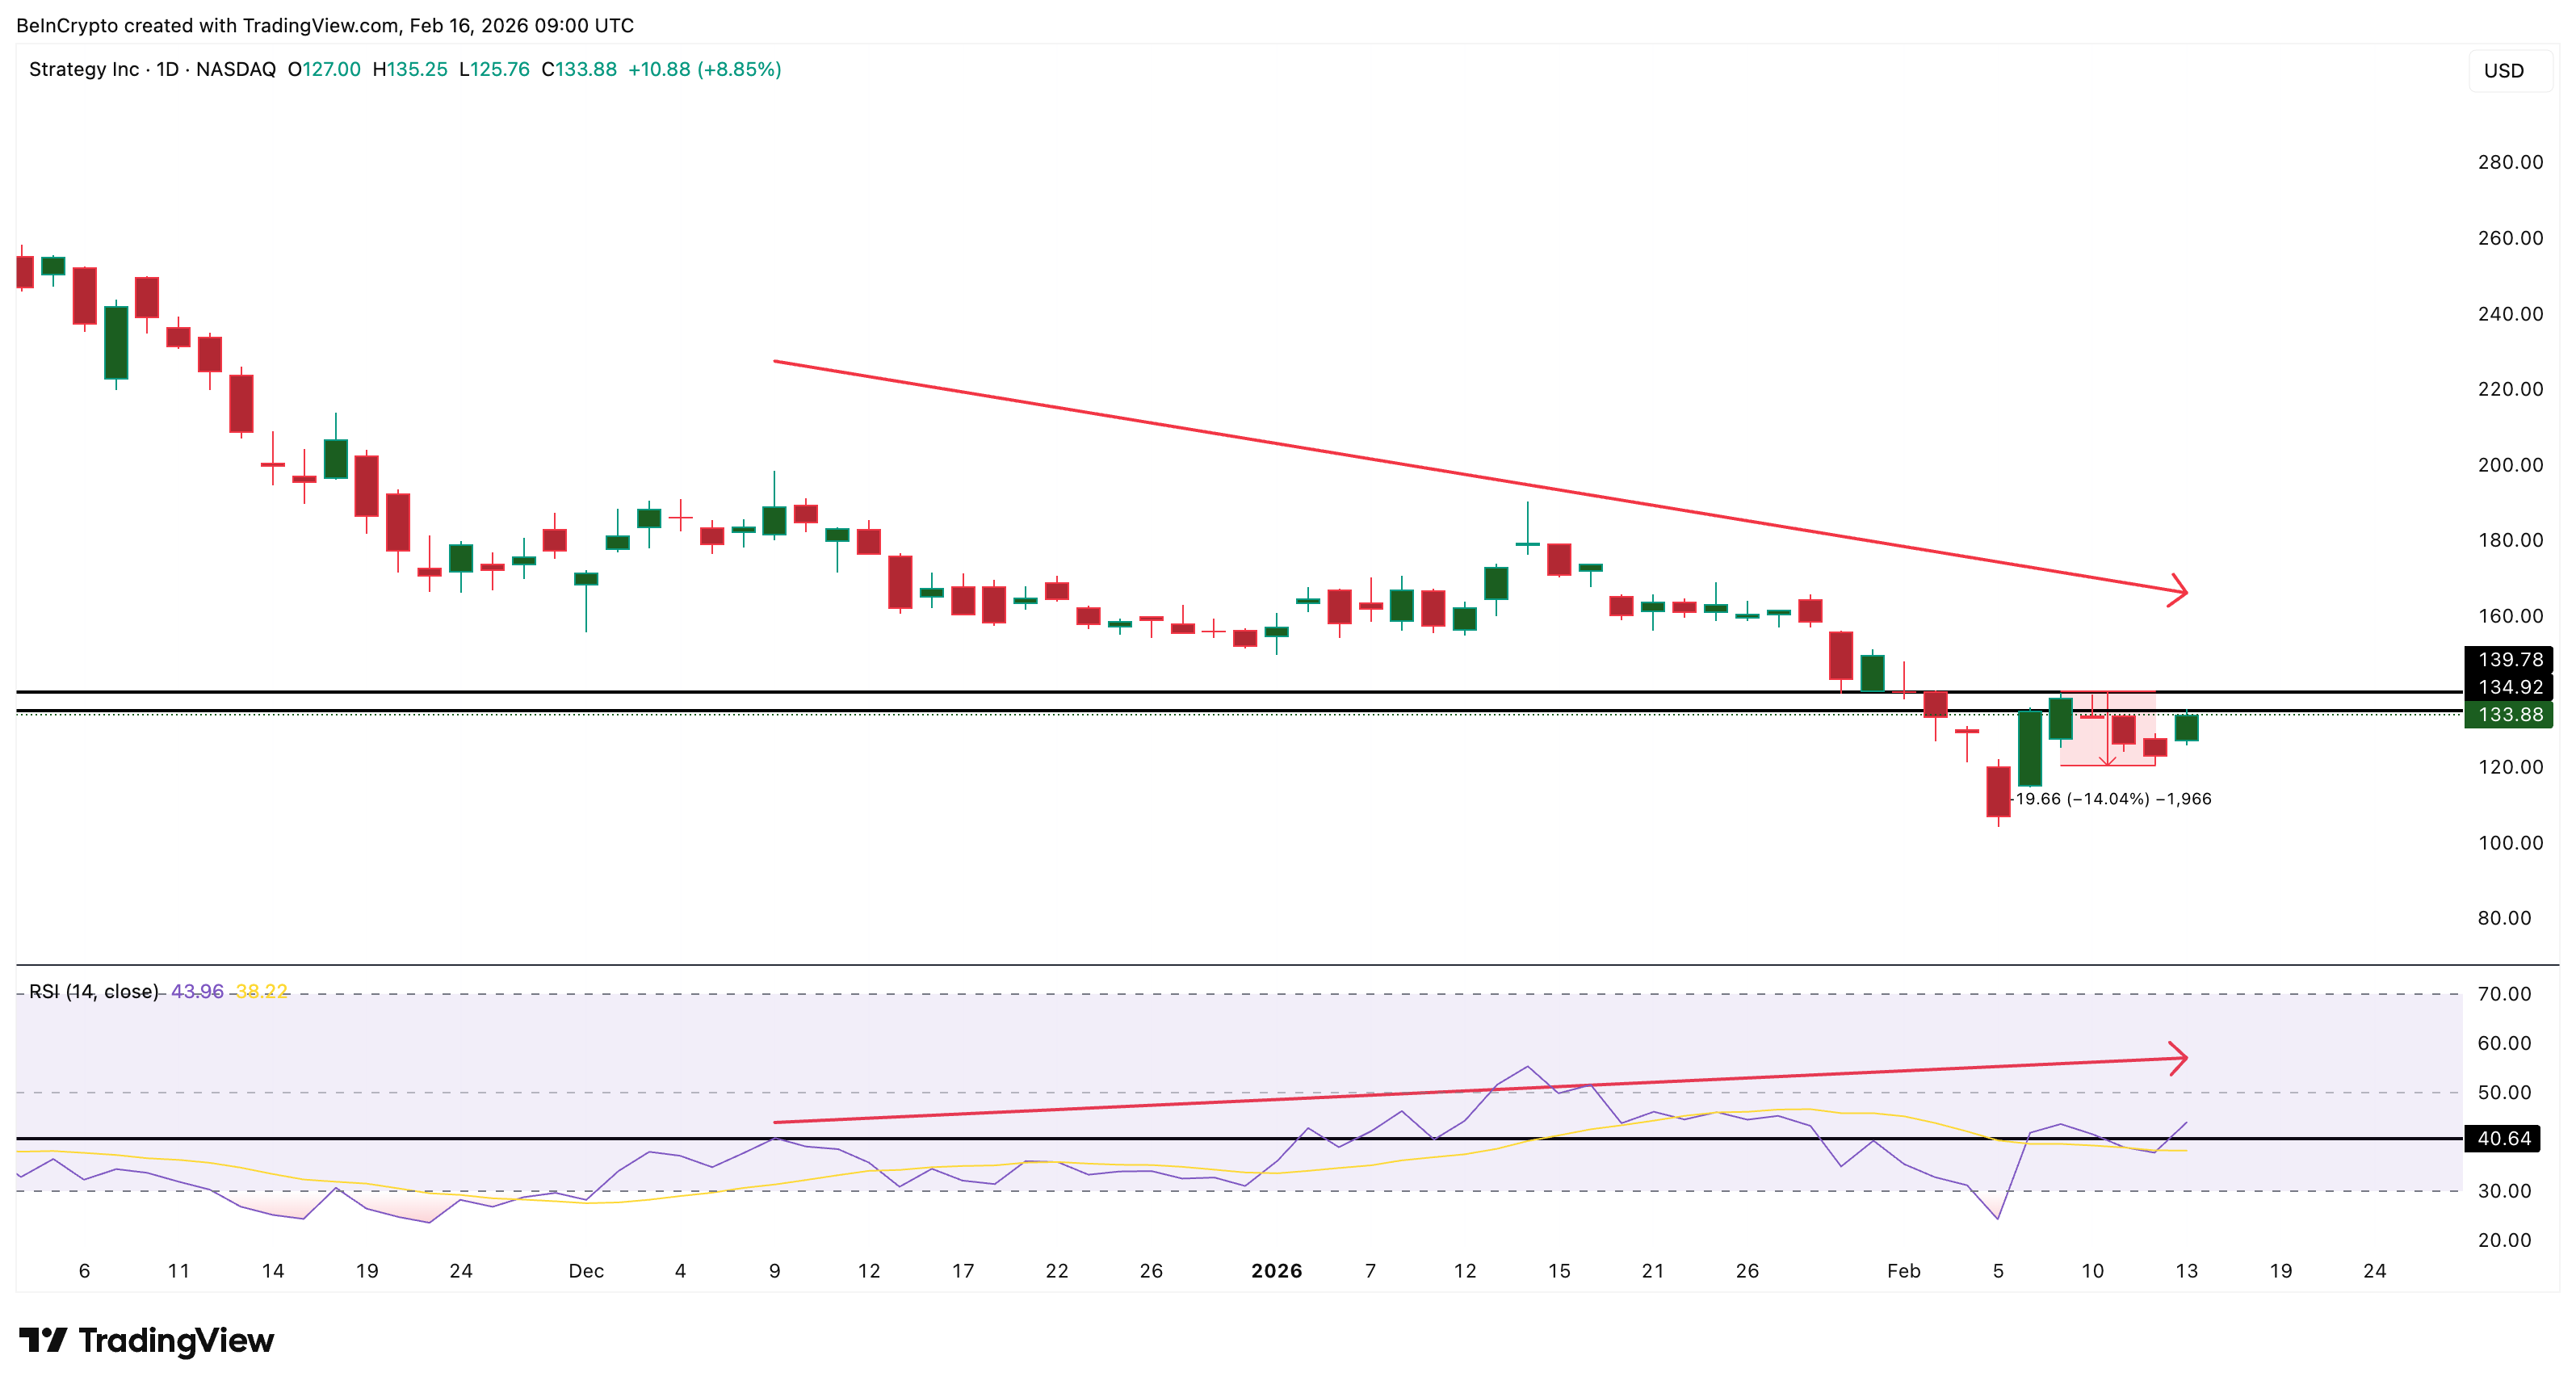
At the same time, the Relative Strength Index (RSI) is showing a hidden bearish divergence. RSI measures buying and selling momentum by comparing recent gains and losses. Between December 9 and February 13, the MicroStrategy price seems to be forming a lower high.
However, during the same period, the Relative Strength Index (RSI), a momentum indicator, has already flashed a higher high. This pattern is called hidden bearish divergence. It shows that even though momentum appears stronger, the underlying price structure remains weak. Sellers may still be in control.
Sponsored
Sponsored
A similar divergence formed earlier between December and February. After that signal, MicroStrategy stock dropped nearly 14%. The same setup is now appearing again.
The key level to watch is $133 ($133.88 to be exact). If the next MicroStrategy (Strategy) stock price candle stays below this level, the correction risk remains active. A move above it would weaken this bearish signal (the hidden divergence) for now and could further the bounce. But that would also mean that Bitcoin’s influence would weaken temporarily.
Institutional Buying Supports Price, While Retail Selling Weakens Conviction
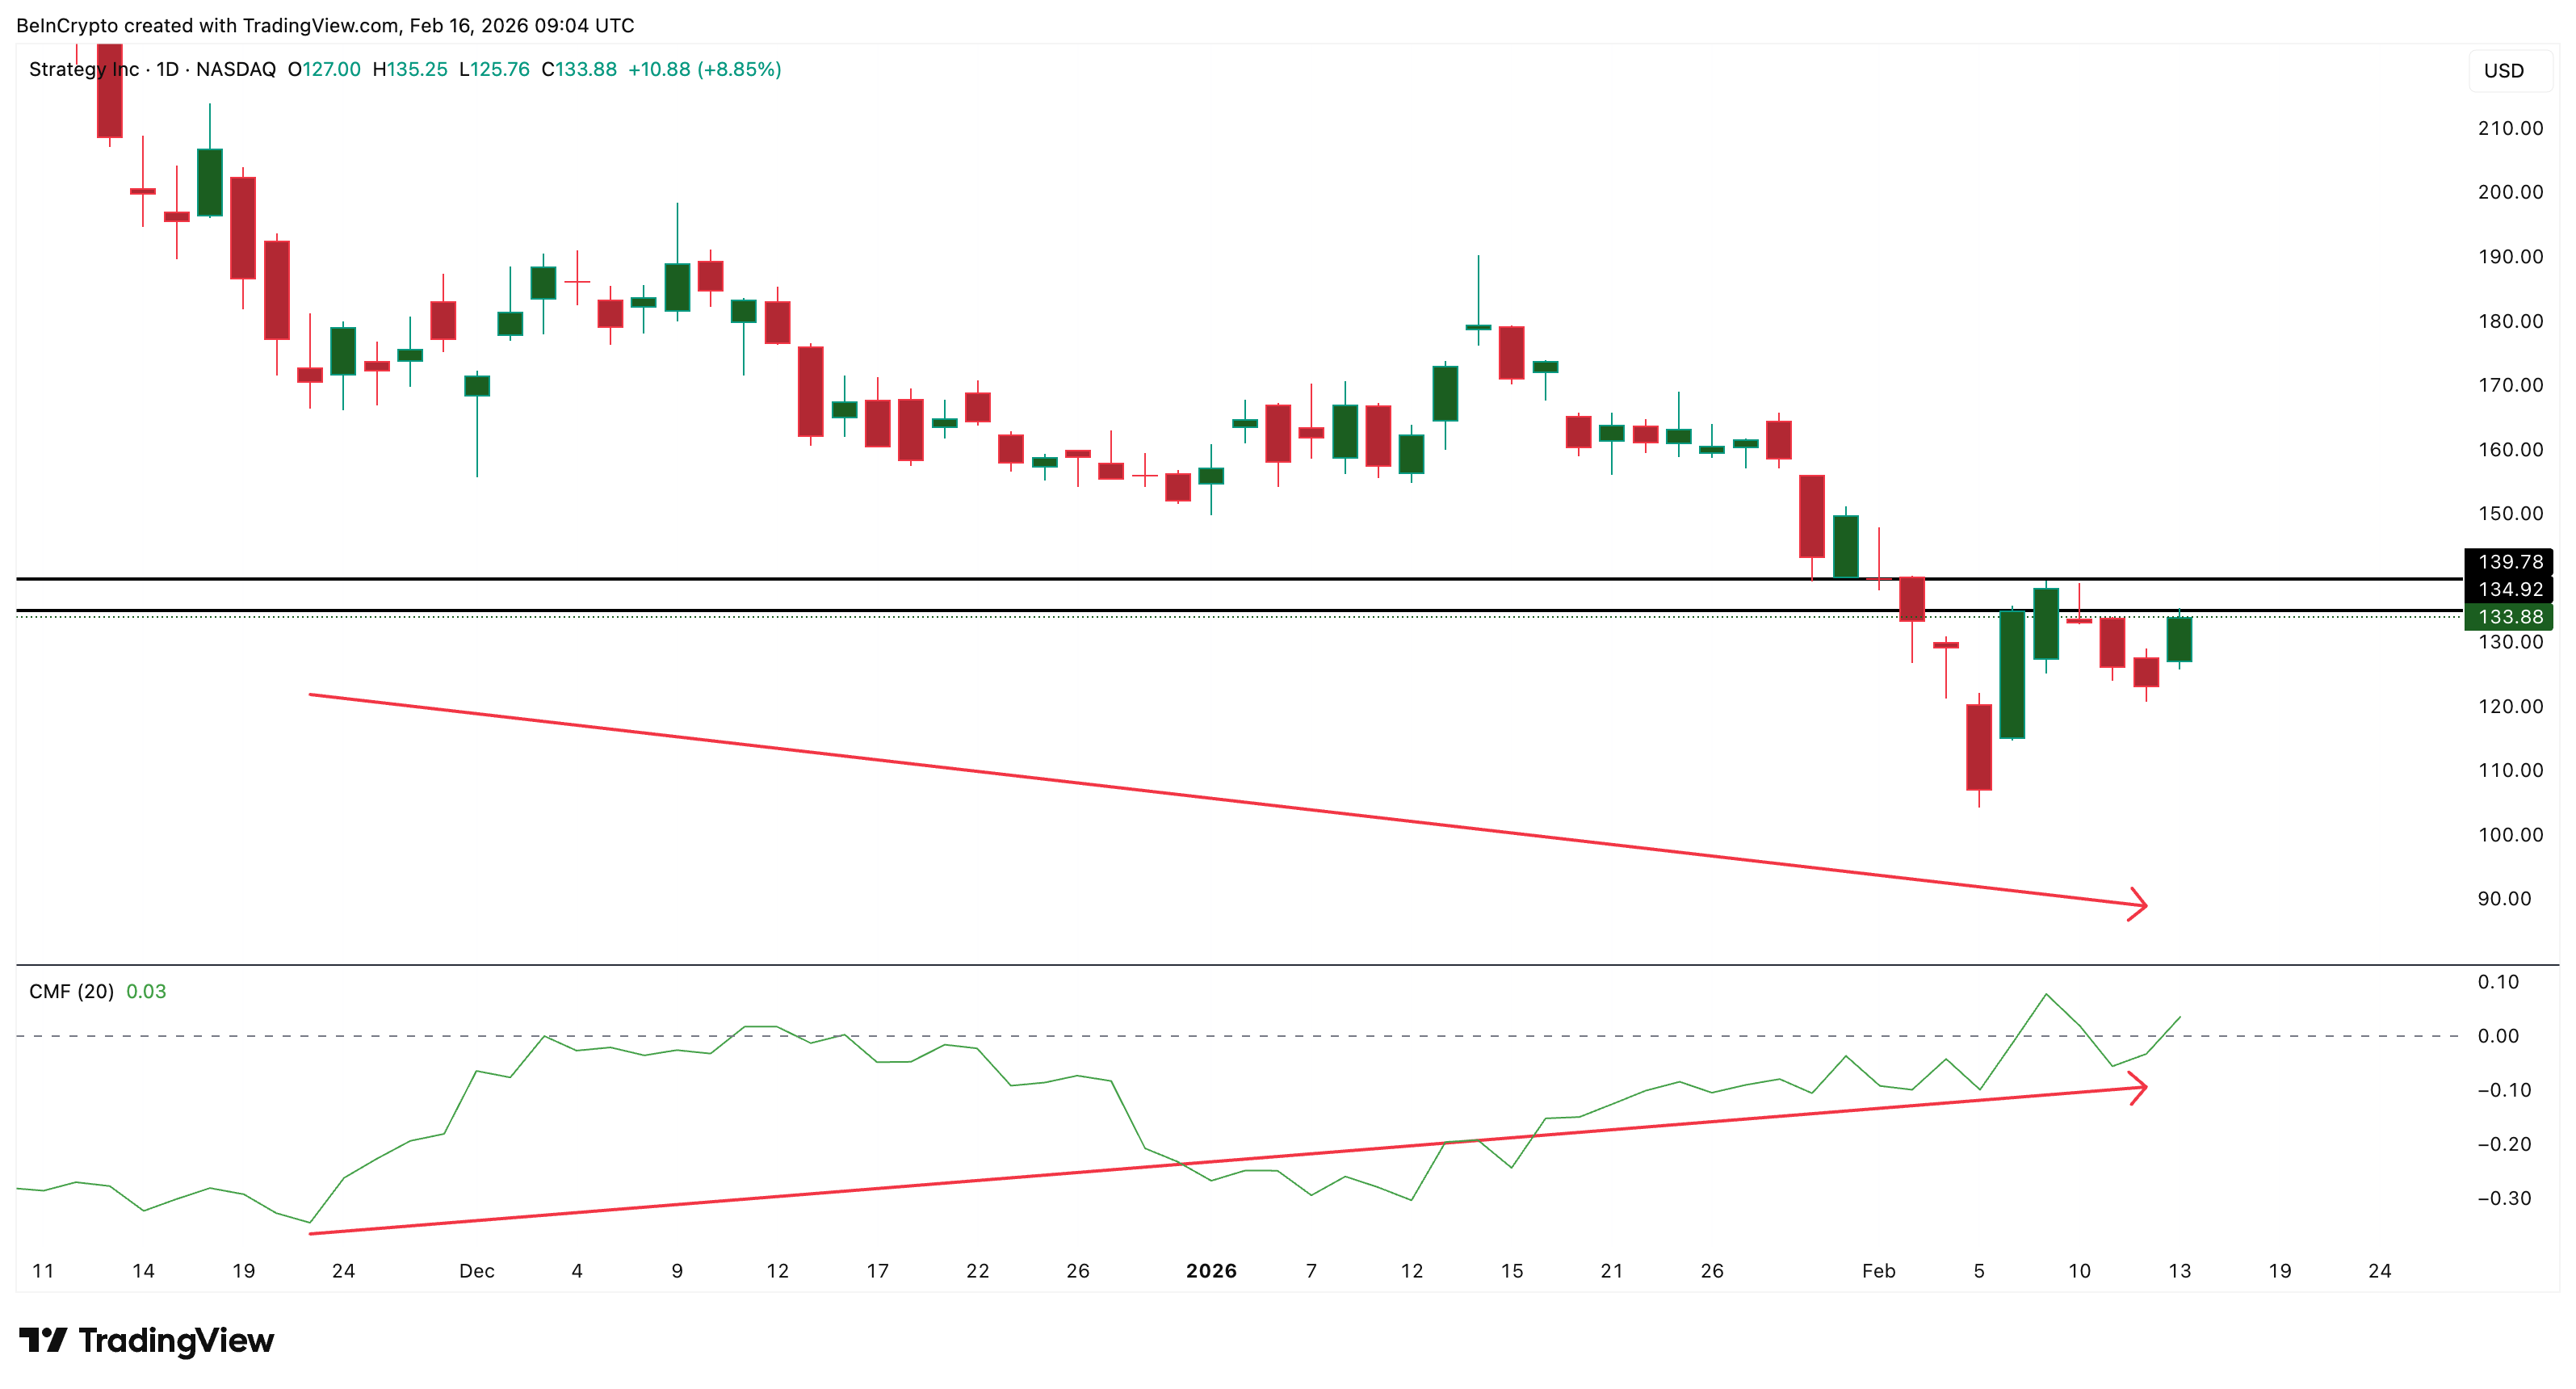
Despite the bearish momentum signal, institutional investors are showing a different behavior. The Chaikin Money Flow (CMF) indicator tracks large money flows into and out of an asset. Since November 21, the MSTR price has trended lower overall. But CMF has steadily moved higher and is now above zero.
This means that large investors have continued to buy even as the price has struggled. Institutional accumulation can reduce downside risk and stabilize prices during corrections.
Sponsored
Sponsored
However, retail investors are showing the opposite trend.
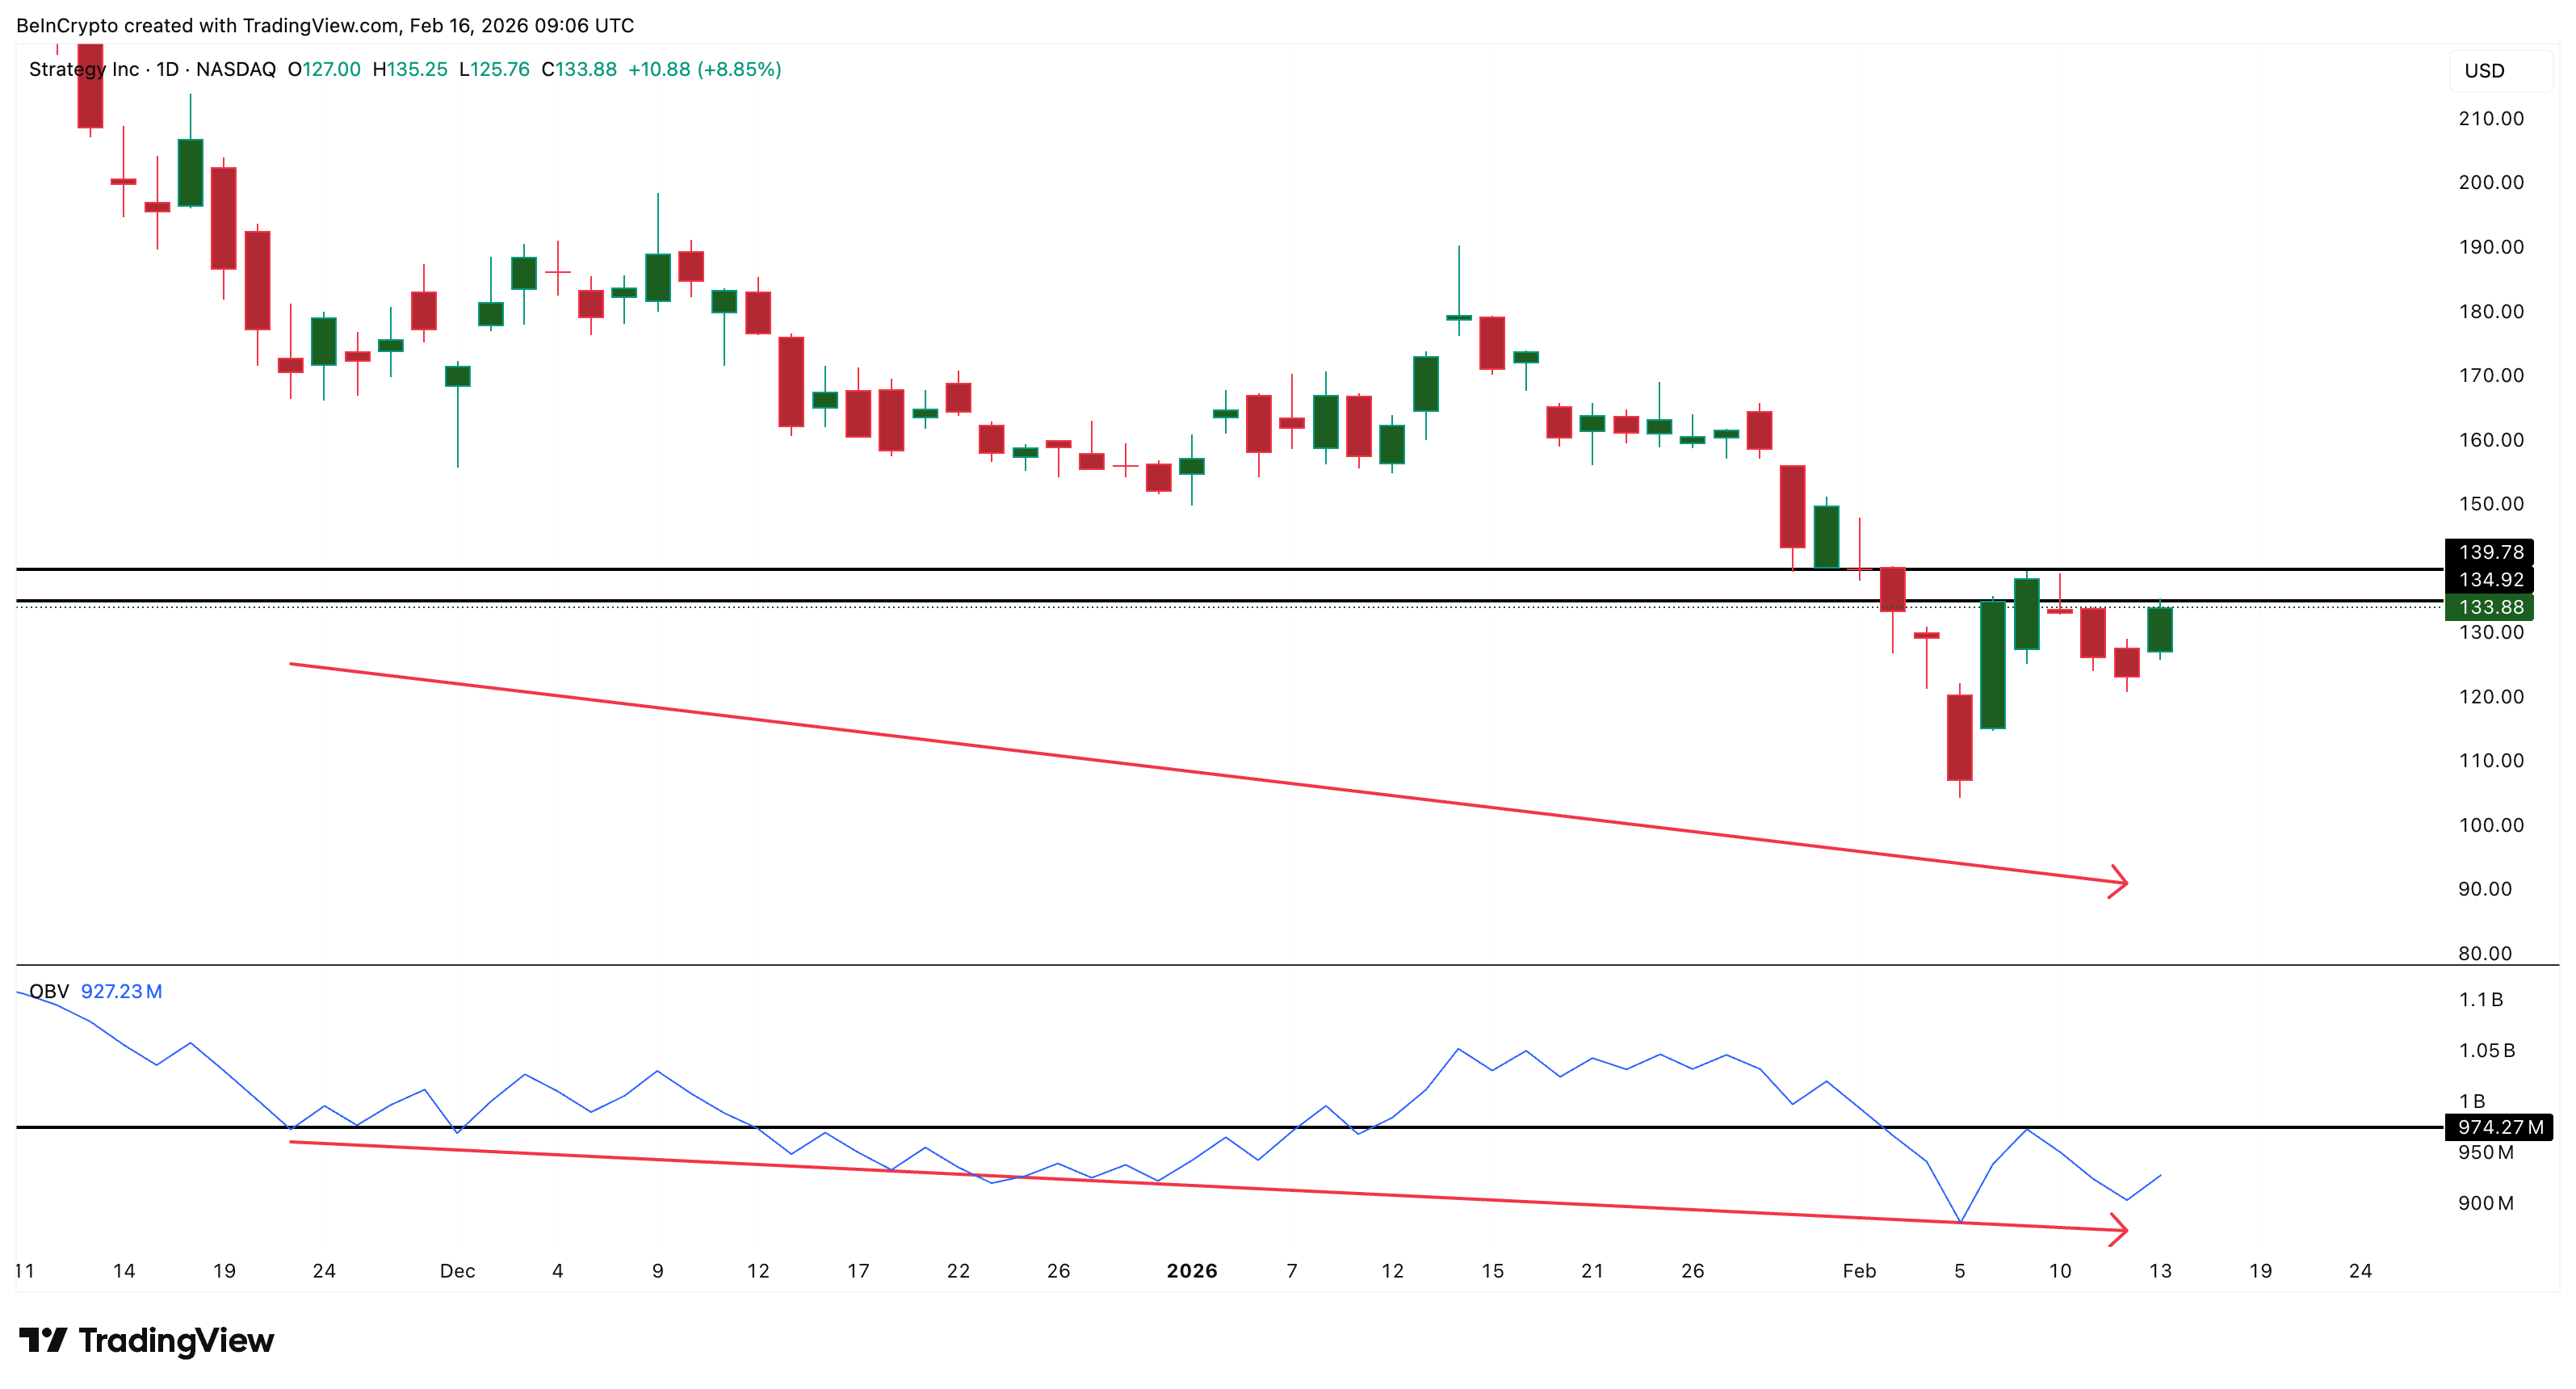
The On-Balance Volume (OBV) indicator tracks cumulative buying and selling volume. Unlike CMF, OBV has been trending lower since November, aligning with the price. This shows that smaller investors have been selling during recent months.
This creates a conflict. Institutional buyers are supporting the price, but retail investors are possibly reducing exposure. The key OBV level now sits near 972 million. If OBV fails to break above this level, it would confirm continued retail weakness. This would increase correction risk and support the forming bearish divergence signal.
This conflict between institutional and retail investors leaves MicroStrategy’s price prediction uncertain in the short term.
Sponsored
Sponsored
MicroStrategy Price Prediction Depends on $139 Breakout or $119 Breakdown
The MSTR price levels now provide the clearest guide to the next move. On the downside, the first key support level sits at $119. This level aligns with the 0.236 Fibonacci retracement and represents a potential 10% decline from current levels. This target also matches the size of previous divergence-driven corrections.
If MicroStrategy stock falls below $119, the next support sits near $106. This would represent a deeper correction and confirm seller control.
On the upside, the most important recovery level is $133, as mentioned earlier, followed by $139. This resistance has capped recent rallies. A confirmed breakout above $139 would signal renewed strength.
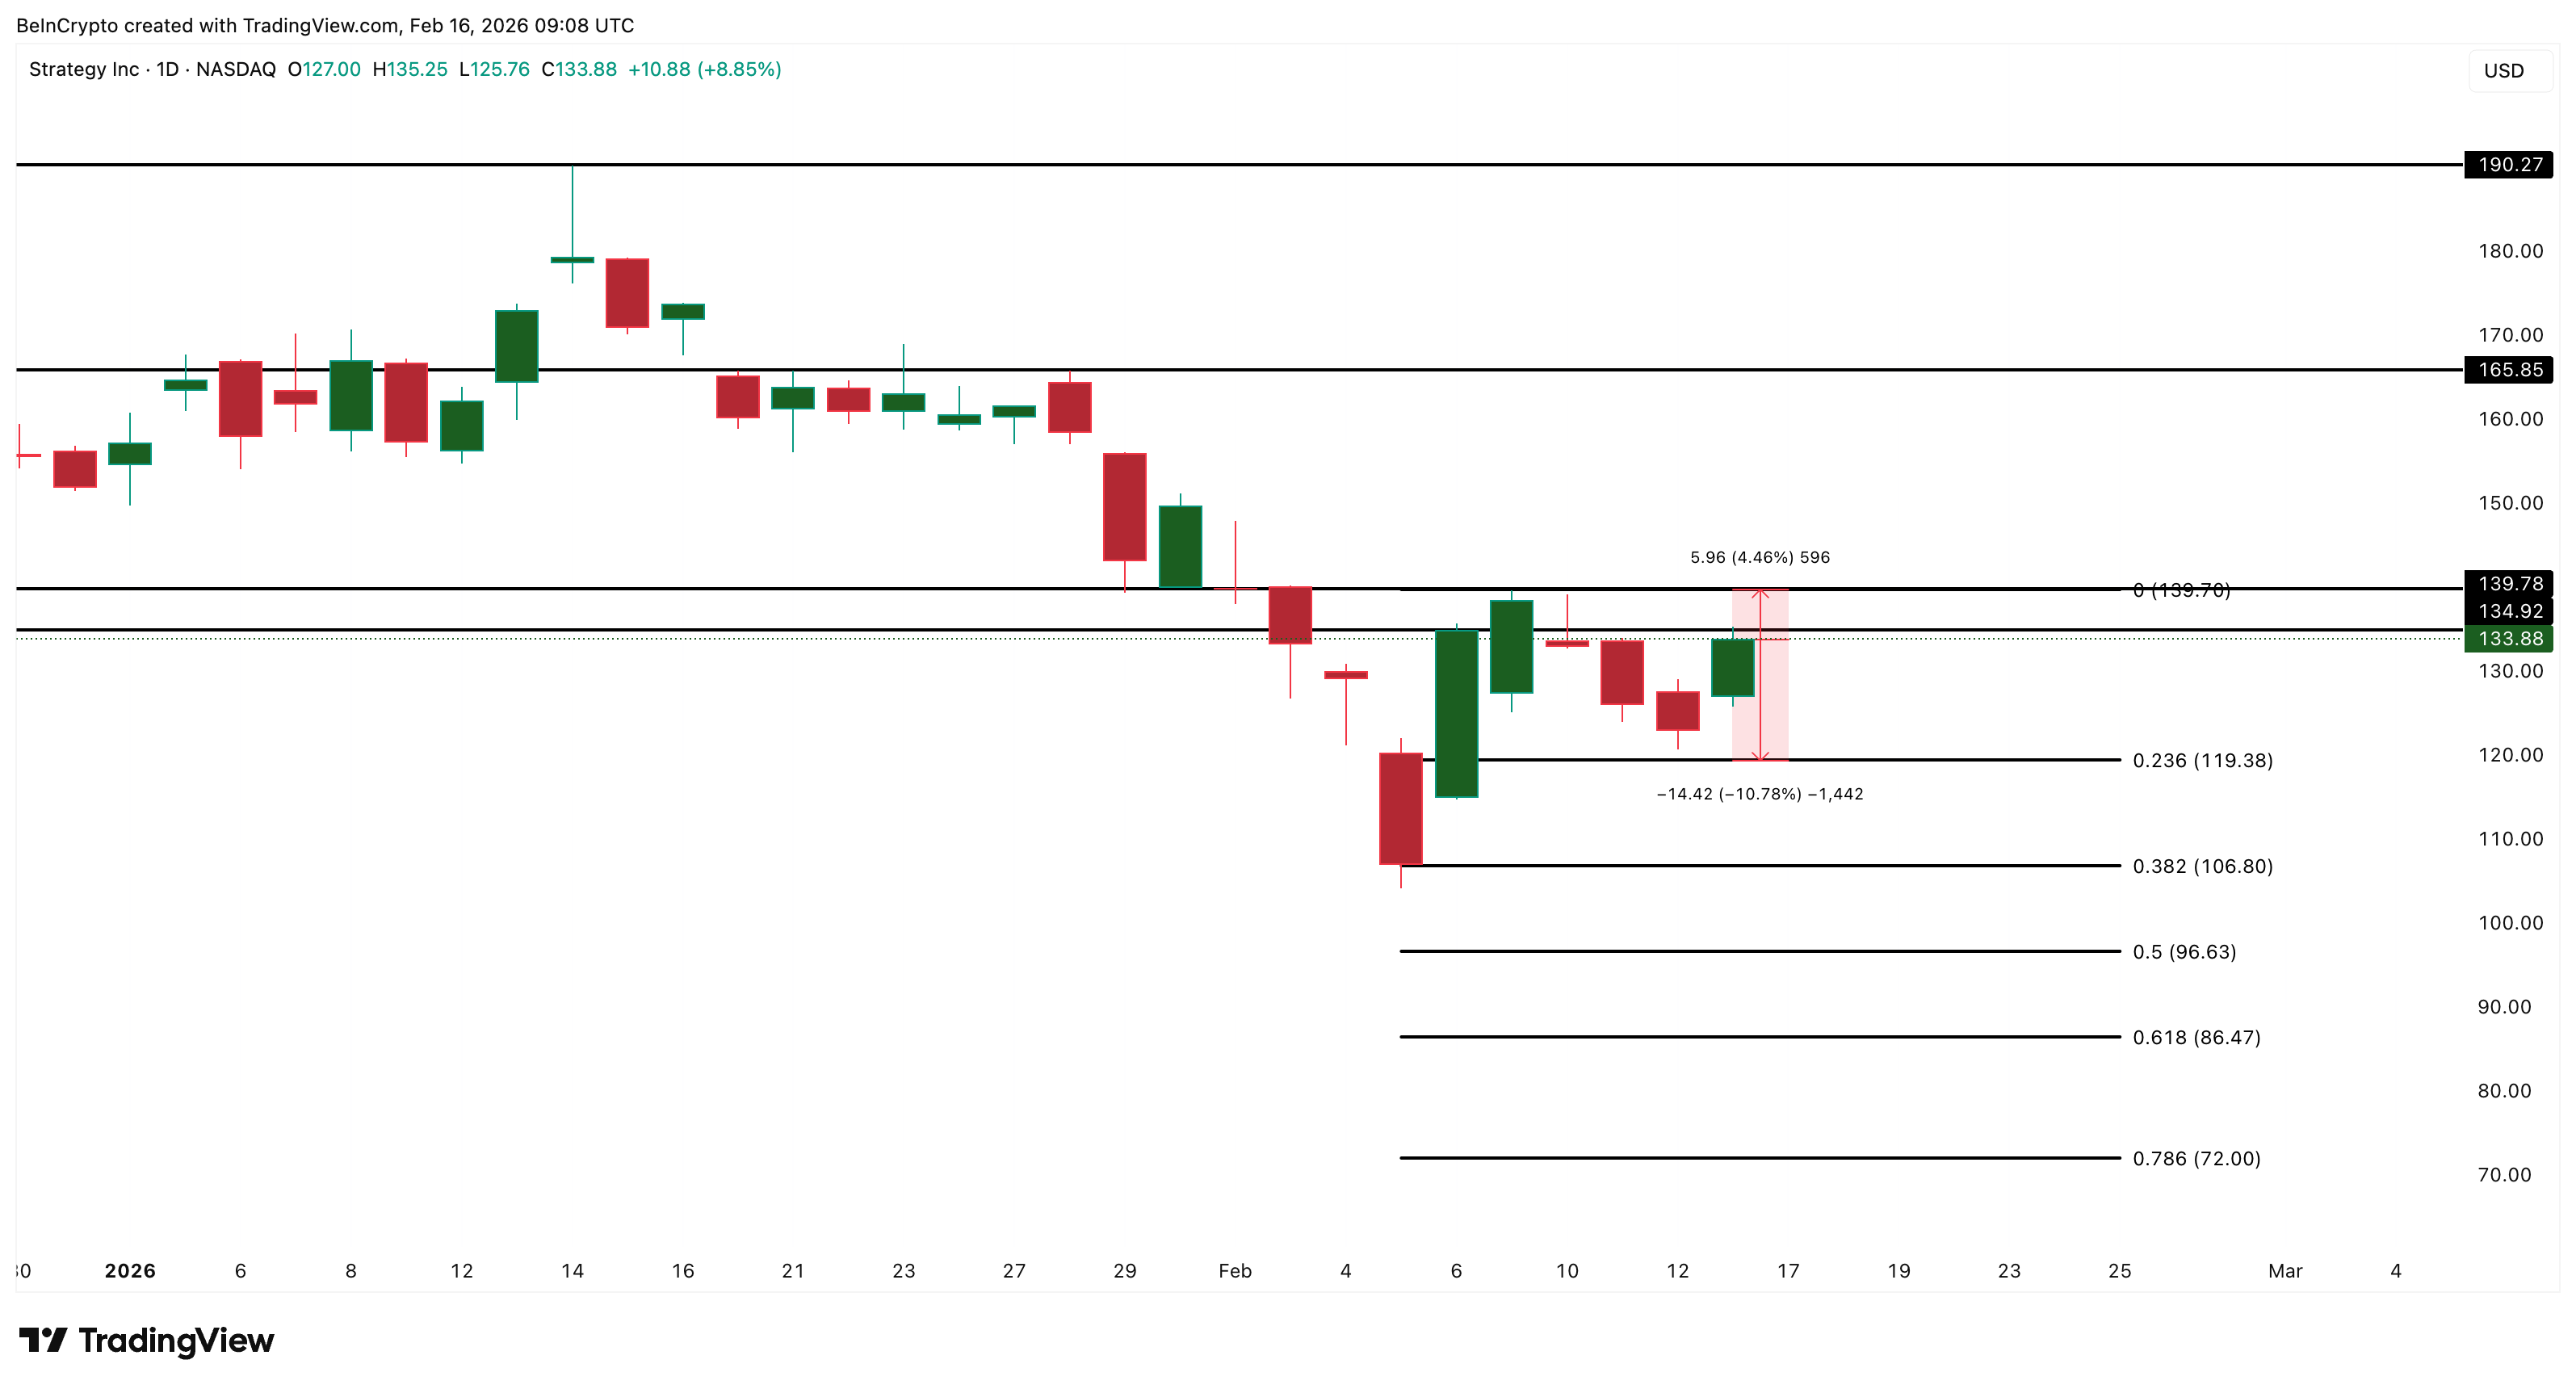
If this breakout happens, MicroStrategy stock could move toward $165. A stronger rally could extend toward $190 if Bitcoin also recovers. However, if Bitcoin weakness continues, MicroStrategy could follow lower due to the strong correlation.
For now, MicroStrategy stock remains at a critical point. The extremely high correlation with Bitcoin means its next move may depend on Bitcoin’s direction. If Bitcoin weakness continues, the MicroStrategy stock price could face a delayed correction. But if institutional buying continues and resistance breaks, the bullish trend could still resume for MSTR.