XRP Leverage Collapses 78% On Binance – The Crowded Trade Has Been Cleared
XRP is trading below $1.40. Weeks of consolidation have given way to renewed selling pressure. And beneath the price action, the derivatives market is telling a story the spot chart cannot.
A CryptoQuant analyst tracking Binance derivatives data has identified a deleveraging cycle of unusual magnitude: XRP’s Estimated Leverage Ratio on Binance has collapsed from 0.59 in mid-July 2025 to 0.13 today — a 78% contraction in eight months. That is not a routine position adjustment. That is a near-complete unwind of the speculative infrastructure that was built during XRP’s most aggressive trading period of the past cycle.

The open interest data confirms the scale of the reset. Binance XRP open interest has fallen to approximately $375 million — a fraction of the highs recorded in previous months, and a figure that reflects a derivatives market that has shed the majority of its leveraged exposure.
What that leaves behind is a market structurally different from the one that existed at the July peak. The crowded trades are gone. The forced liquidation risk has diminished. The reflexive, leverage-driven volatility that defined XRP’s most volatile sessions has lost most of its fuel.
Whether what remains is a floor or a falling knife depends entirely on what the spot market does next.
A Cleaner Market Is Not the Same as a Bullish One
The analyst’s conclusion is measured and precise: the simultaneous contraction in both leverage ratio and open interest represents a broader structural reset in Binance’s XRP derivatives market — not a single metric moving in isolation, but two confirming each other in the same direction over the same period.

What that reset removes is as important as what it leaves behind. A derivatives market carrying a leverage ratio of 0.59 is a market one sharp move away from a cascade of forced liquidations — positions unwinding not because holders changed their view, but because margin calls left them no choice. At 0.13, that reflexive amplification mechanism has been largely dismantled. The market is lighter, less crowded, and significantly less exposed to the kind of liquidation-driven volatility that has defined XRP’s most chaotic sessions.
The analyst frames the forward implication carefully, and the language deserves to be preserved: the market is not primed for a rally. It is primed for a move — in either direction — that will be driven by conviction rather than leverage. When the next catalyst arrives, the price response will reflect genuine demand or genuine supply, not the mechanical amplification of positions that should never have been that large.
That is what a clean setup means. It is a better starting point. It is not a destination.
The XRP Price Structure Has Not Improved
XRP is trading at $1.3753, down 2.77% on the day. The session opened at $1.4145, reached a high of $1.4165 within the first hour, and has sold off consistently since — a candle that rejected immediately at the open and has found no meaningful bid. That price action, on a day that began with a test of the $1.42 area, is a statement.
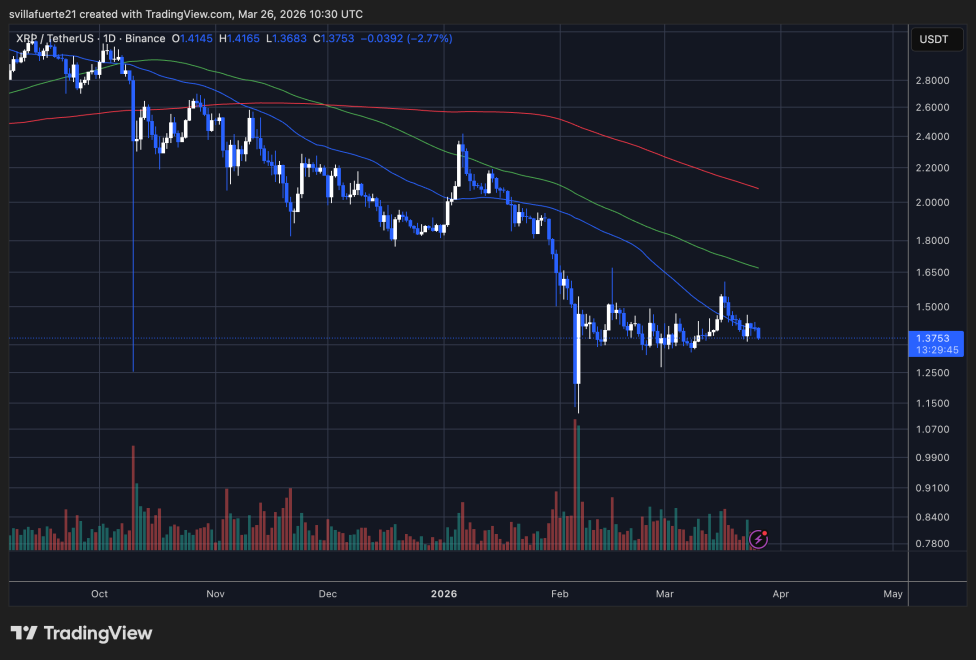
The daily chart behind it offers no comfort. XRP peaked near $3.30 in late September 2025 and has been in a continuous downtrend for six months without a single higher high. Every attempted recovery — the December consolidation near $1.90, the brief January rally to $2.40, the post-capitulation bounce from $1.15 — has been sold into. Each one was lower than the one before it.
All three moving averages are declining in sequence. The 50-day MA has crossed below the 100-day MA — confirming a death cross on the intermediate timeframe — and both are sloping sharply lower. The 200-day MA, descending from approximately $2.10, sits as the most distant and most significant overhead resistance. Price has not traded near it since January.
Today’s close threatens to break below the $1.40 support level that has contained the range since February. A daily close beneath it puts $1.15 — the February capitulation low — back on the table as the next structural reference point.
Featured image from ChatGPT, chart from TradingView.com

Editorial Process for bitcoinist is centered on delivering thoroughly researched, accurate, and unbiased content. We uphold strict sourcing standards, and each page undergoes diligent review by our team of top technology experts and seasoned editors. This process ensures the integrity, relevance, and value of our content for our readers.