Bitcoin Eyes $78K Breakout as Momentum Indicators Remain Neutral
Key Takeaways
Bitcoin holds near $77,400 on May 20 as BTC tests resistance near the $78,000 zone.Market indicators show mixed momentum, with MACD and Momentum flashing sell signals.BTC bulls now watch the $77.5K-$78K breakout zone for a possible move toward $80K.
Bitcoin Chart Outlook
Bitcoin is priced at $77,440 during the early morning data capture window, reflecting a gain of roughly 0.4% over the previous 24 hours while maintaining a market cap near $1.55 trillion. Trading volume holds steady at approximately $26.69 billion, with intraday price action fluctuating between $76,181 and $77,579.
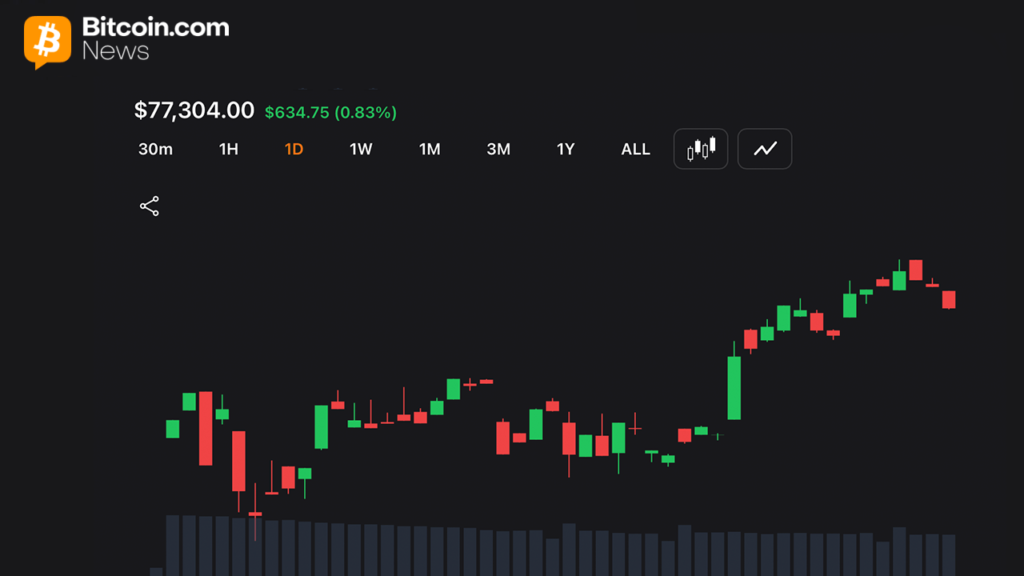
Price activity on the 1-hour chart shows tightening consolidation after bullish momentum lifts BTC from the $76,600 region. Larger green candles initially support the recovery move, though smaller candles near resistance indicate fading momentum as traders await additional volume confirmation before extending positions higher. The 1-hour timeframe continues to reflect cautious bullish sentiment despite slowing momentum near local highs.
Traders monitoring short-term positioning note that the $77,500 to $78,000 region remains the primary decision zone for near-term direction. Aggressive long setups are centered between $77,000 and $77,200 with stop-loss positioning below $76,500, while upside targets remain near $77,800, $78,500 and $79,200. Market structure suggests bitcoin could continue stabilizing if buyers defend breakout support above the upper $76,000 region. However, bearish reversal candles near resistance could reopen downside pressure toward $76,500 and potentially $75,300 if momentum deteriorates.
On the 4-hour chart, bitcoin remains locked in a consolidation structure following a sharp corrective phase from recent highs near $82,800. Price action continues forming higher lows around the $76,000 region, signaling improving short-term structure despite broader uncertainty. Resistance between $77,300 and $77,600 remains heavily monitored as BTC compresses beneath overhead selling pressure.
Traders view the range as a pivotal breakout area that could determine whether bitcoin resumes a recovery rally toward $78,500, $79,200 and potentially $80,000, or resumes corrective downside momentum. Failure to maintain support above $76,500 could expose BTC to renewed weakness toward $76,000, $75,300 and possibly $74,000.

The daily chart continues showing bitcoin within a broader bullish structure despite the recent retracement from the $82,800 peak. BTC stabilizes within a major support zone between $76,000 and $77,000 as selling pressure appears to moderate. Daily candles suggest buyers are beginning to absorb downside momentum, although stronger bullish continuation signals remain absent until BTC can reclaim resistance between $78,500 and $80,000.
Traders identify $73,300 as a major macro support level, while daily closes below $75,000 could increase the probability of extended downside continuation. The broader technical outlook, therefore, remains cautiously constructive but dependent on confirmation from stronger buying activity above key resistance thresholds.

Oscillator readings remain largely neutral across the indicator set, reinforcing the market’s indecisive near-term structure. The relative strength index ( RSI) at 47 signals balanced momentum conditions, while the Stochastic oscillator prints 15 and also reflects neutral positioning. The commodity channel index (CCI) (20) registers a negative 113, generating a bullish signal despite broader hesitation across other momentum indicators.
The average directional index (ADX) holds at 22, showing limited trend strength, while the Awesome oscillator prints negative 1,030 and remains neutral. Momentum registers a negative 4,847 with a bearish signal, while the moving average convergence divergence ( MACD) level stands at 272 and also reflects bearish short-term momentum conditions.
Moving averages (MAs) continue to present a mixed technical backdrop with short-term weakness offset by longer-term support stability. EMA (10) at 78,296 and SMA (10) at 78,823 both generate sell signals. Additional weakness appears in EMA (20), SMA (20), EMA (30), and SMA (30), all of which remain above current price levels with bearish positioning.
However, EMA (50), SMA (50), EMA (100), and SMA (100) continue generating buy signals, suggesting medium-term support remains intact. Longer-term resistance persists at EMA (200) and SMA (200), both of which continue signaling sell conditions above current market pricing. Overall, bitcoin’s technical structure remains neutral with a slight bullish undertone as traders await stronger confirmation before anticipating a broader trend reversal.
Bull Verdict:
Bitcoin maintains a cautiously bullish outlook as BTC continues holding above the critical $76,000 support zone while buyers defend higher lows across shorter timeframes. A confirmed breakout above the $77,500 to $78,000 resistance region could strengthen upside momentum toward $78,500 and potentially $80,000 if volume and broader market sentiment improve.
Bear Verdict:
Bitcoin remains vulnerable to renewed downside pressure if resistance near $77,500 to $78,000 continues rejecting bullish advances. A breakdown below $76,500, followed by sustained weakness under $75,000, could accelerate corrective momentum toward deeper support levels near $74,000 and $73,300.