Bitcoin Momentum Weakens as BTC Price Support at $75K Becomes Key

Market analysts say Bitcoin (BTC) is showing “momentum exhaustion” after its 8% drop from multi-month highs above $82,000, with bulls expected to defend key crucial support levels.
Key takeaways:
Bitcoin momentum weakens after rejection above the $82,000 level.Analysts warn BTC could fall to $65,000 if support at $74,000-$76,000 fails.
Bitcoin’s price momentum is “weakening”
Private wealth manager Swissblock stated that Bitcoin’s momentum is fading following failure to “sustain expansion” above $82,000.
Swissblock said that Bitcoin’s positive momentum has been losing “force with every bounce,” contributing to the latest drop to $76,000.
Related: Bitcoin price stays under $77K as US bond yields near 20-year highs
Bitcoin is now trading at $77,200, with the true market mean and the short-term holder cost basis around $78,000 now acting as immediate resistance.
“Bitcoin is losing its capacity to regenerate strong positive momentum internally,” the wealth manager said, adding:
“Momentum exhaustion is not the breakdown itself. It is the process that usually comes before it.”
Bitcoin performance impulse. Source: Swissblock
Echoing this observation, analyst Axel Adler Jr pointed out that Bitcoin’s slow impulse performance indicator has “turned negative for the first time since April,” adding:
“Momentum is fading exactly as macro pressure is rising. Without Slow back above zero, every rally is unconfirmed.”
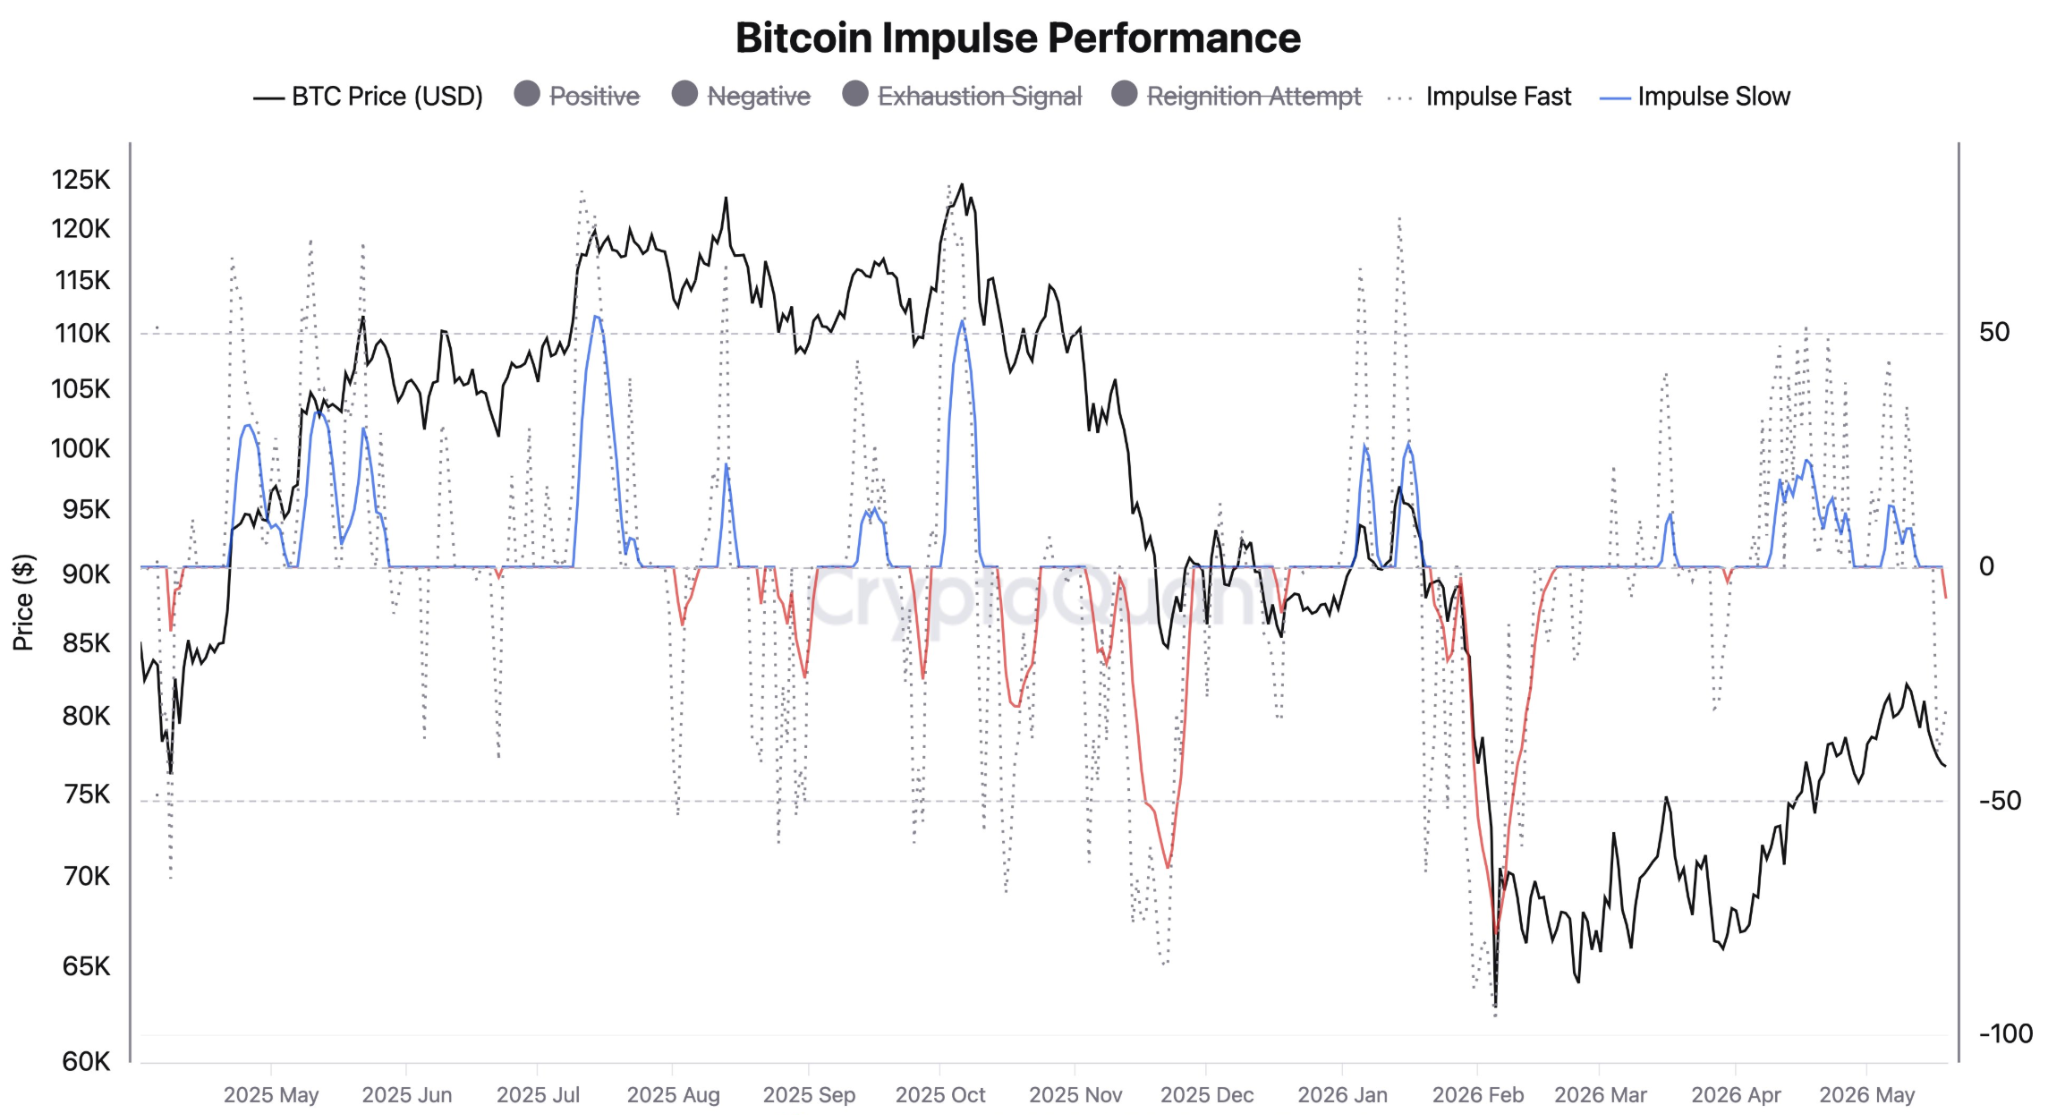
Bitcoin impulse performance. Source: CryptoQuant
Bitcoin’s price momentum indicator has also decreased significantly, falling by 29% over the last week to 47.1 from 66.7, indicating a “shift from strong upward to weakening momentum,” Glassnode said in its latest Market Pulse report, adding:
“Bitcoin’s market structure is beginning to soften as momentum, spot demand, and speculative positioning weaken across the market.”
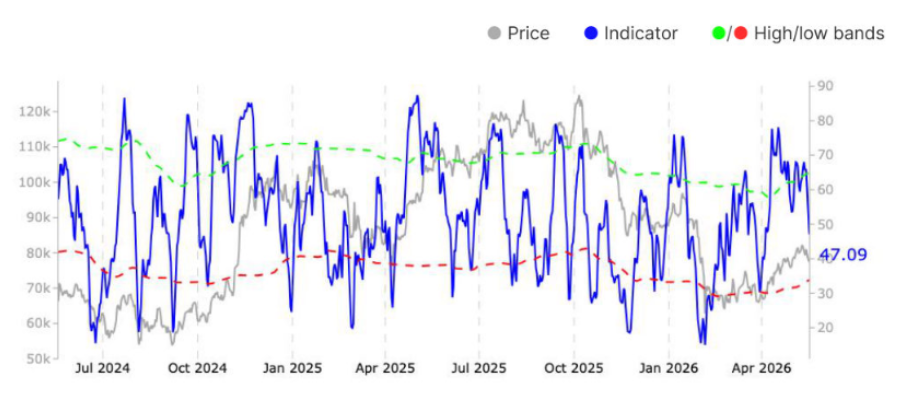
Bitcoin price momentum. Source: Glassnode
Key Bitcoin support levels to watch
As Cointelegraph reported, Bitcoin’s upside hinges on bulls keeping the price above the $74,000-$75,000 zone, as it has repeatedly served as key support over the last two years.
This is where the key moving averages are found, including the 50-day exponential moving average (EMA), 100-day EMA and the 50-day simple moving average (SMA), as shown in the chart below.
This reinforces the importance of this demand zone and the fact that BTC/USD has not yet dipped below, “may be the most bullish thing” for Bitcoin, trading resource Material Indicators said in a recent X post.
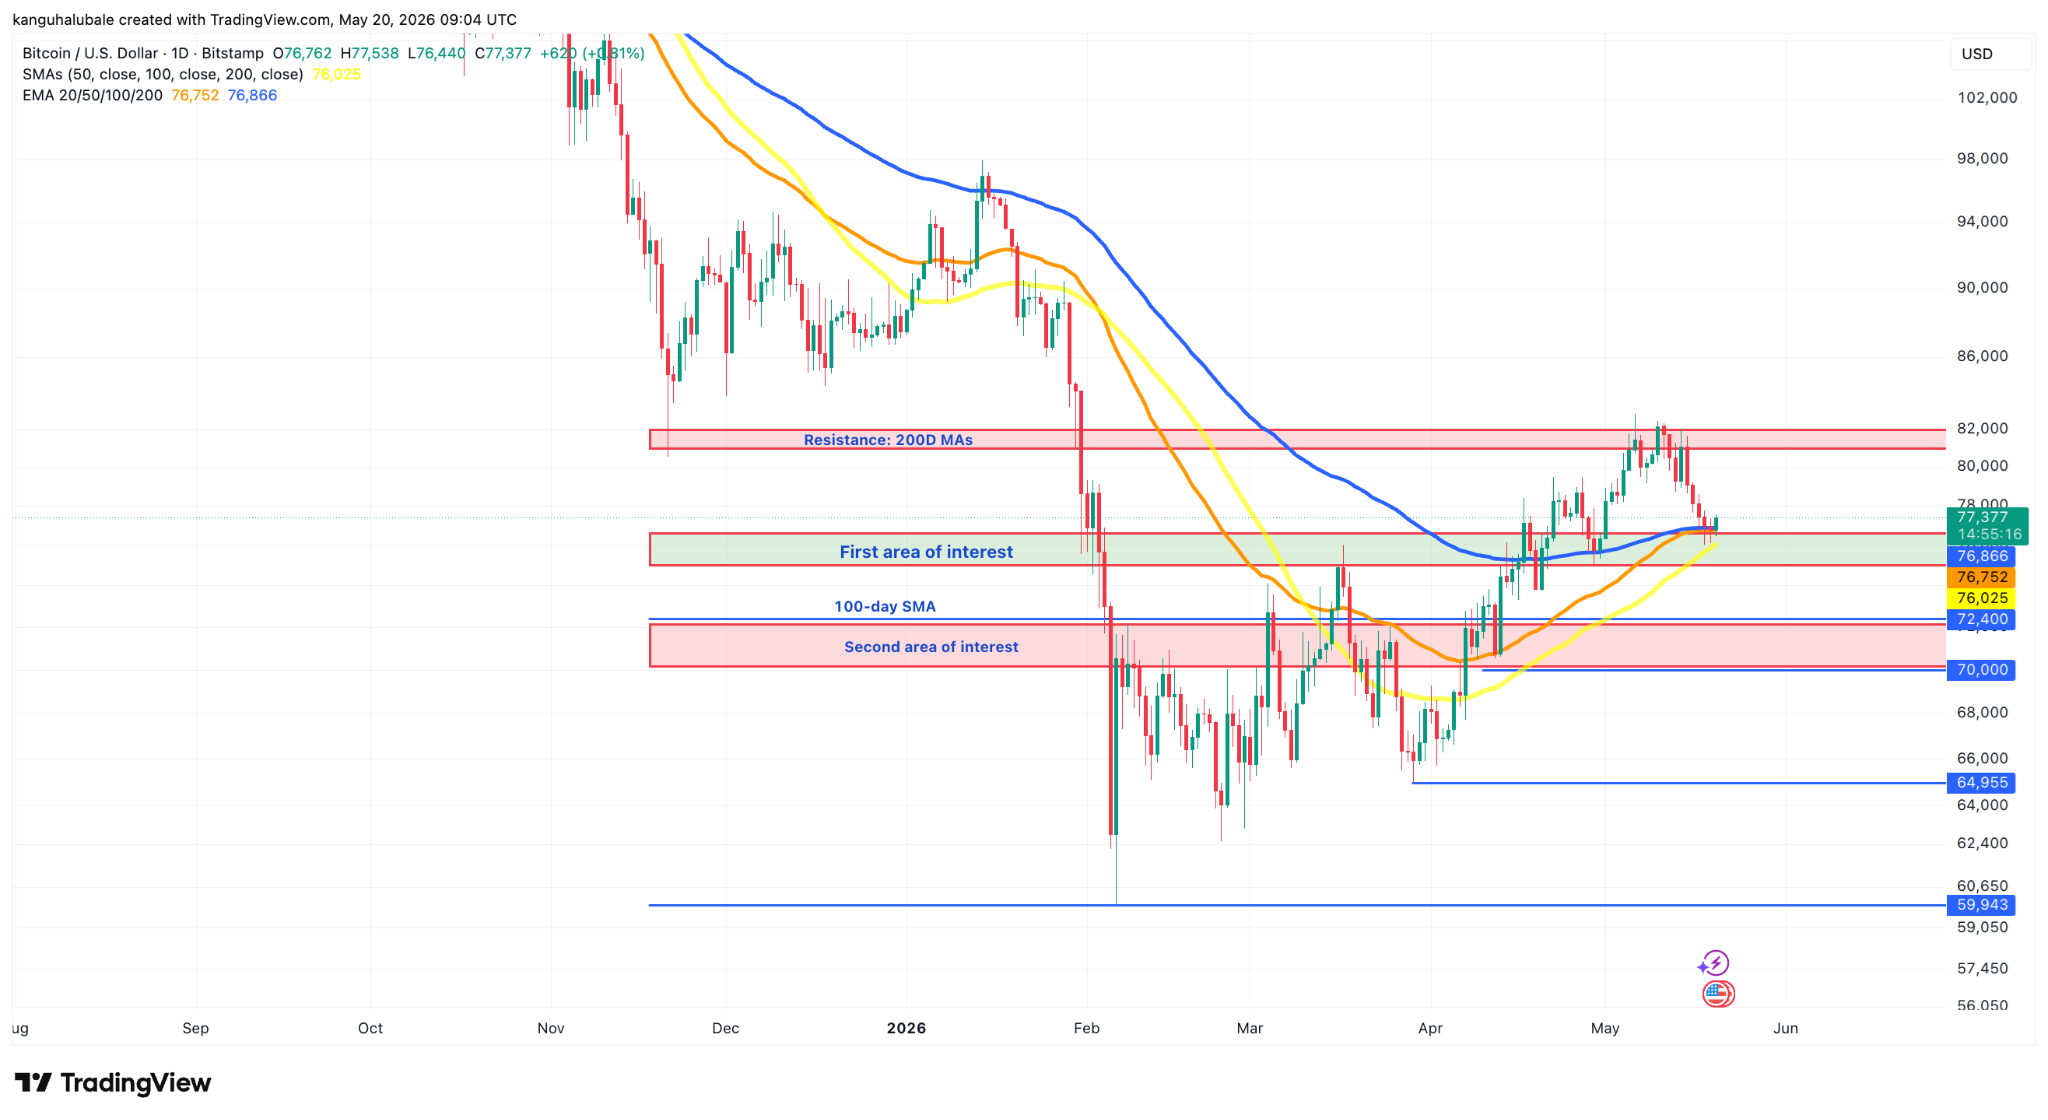
BTC/USD daily chart. Source: Cointelegraph/TradingView
The second area of interest lies between $72,000 (100-day SMA) and the psychological level at $70,000.
If this level is lost, BTC price could drop to $65,000 or later revisit the macro low below $60,000, reached on Feb. 6.
Analyst Daan Crypto Trades Bitcoin said that if the support at $75,000-$76,000 is lost, the BTC/USD pair would retest the $72,000 “level pretty quickly.”
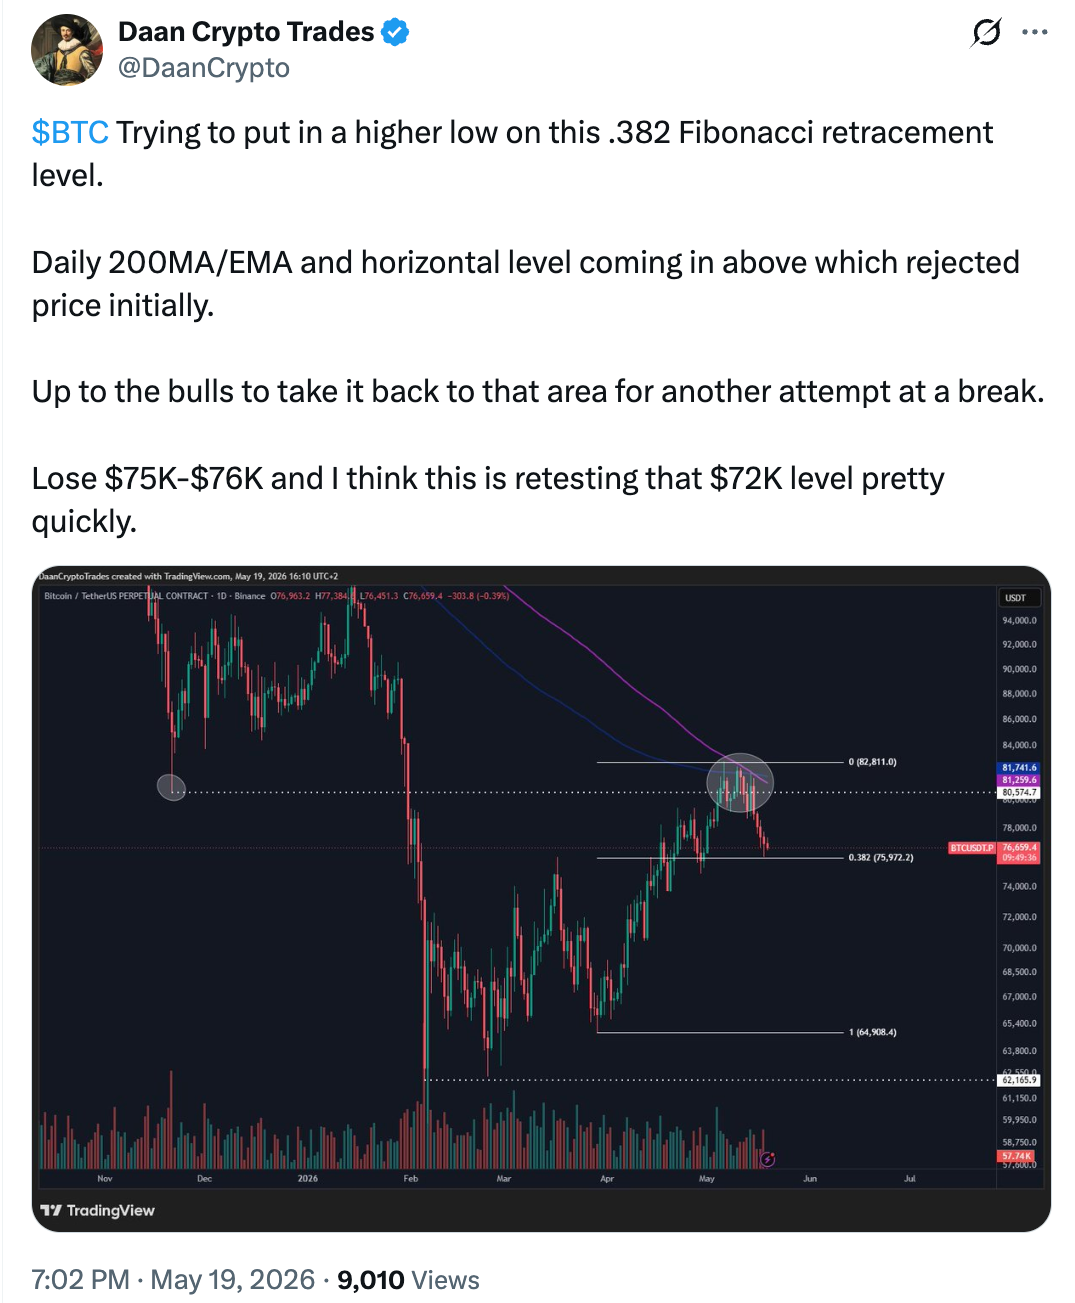
BTC/USD daily chart. Source: X/Daan Crypto Trades
Zooming out, trader CryptoAmsterdam said it would be “good” if the BTC/USD pair held support at $74,000-$76,000 (the orange area on the three-day chart below) with other areas of defense around $72,000.
The analyst sets downside targets at $60,000 and $50,000 in case these support levels are breached.
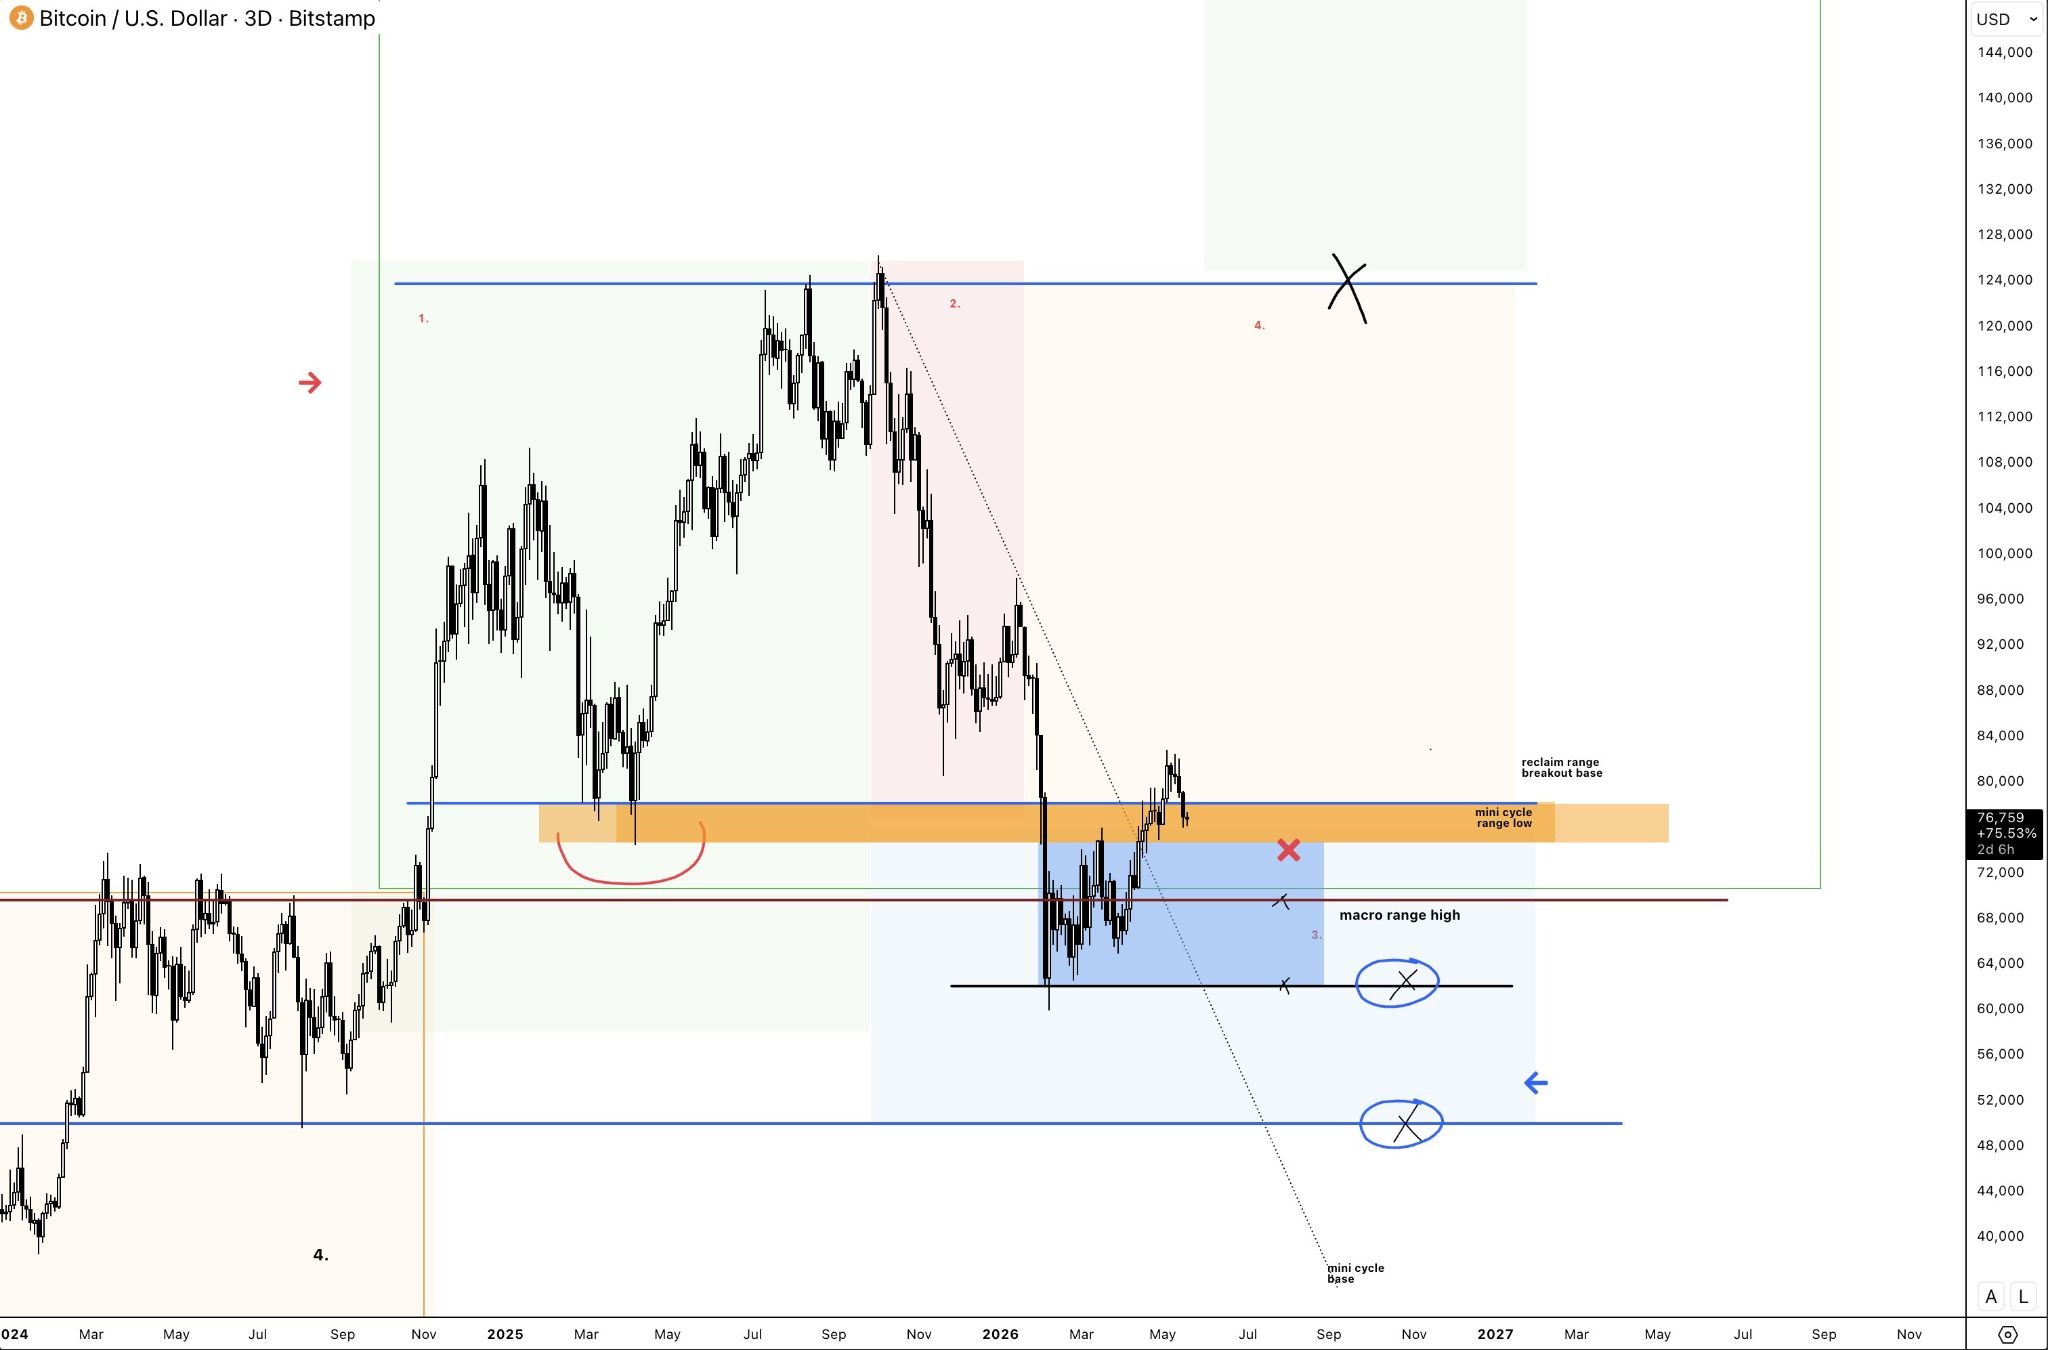
BTC/USD three-day chart. Source: X/CryptoAmsterdam
As Cointelegraph reported, a key support level for the bulls was the 50-day SMA at $75,600, which, if lost, could see the BTC/USDT pair sink to $65,000.