AMD Price Prediction: Below Every Moving Average as Open Interest Surges 10.66%

Home
Latest reporting
Price forecast
The Binance AMD tokenized stock contract fell 2.37% to $508.65 as of the October 31, 2026, 10:00 UTC observation, trading beneath all five supplied moving averages while Binance futures open intere…
Market analysis includes conditional scenarios, not assured price outcomes or investment advice. Check the data, assumptions and dates cited.
A Contract at the Pivot With No Directional Resolution
The Binance AMD tokenized stock contract printed $508.65 at the 10:00 UTC observation on October 31, 2026, down 2.37% on the prior 24-hour session. The day’s range of $493.64 to $522.95 spans $29.31 — broadly consistent with the 14-period Average True Range of $25.48, meaning the session’s movement fell within a normal volatility band rather than representing an outlier dislocation. The supplied pivot point sits at $508.41, placing the contract almost precisely at the technical fulcrum with no firm directional resolution in the price structure itself.
All Binance contract figures — prices, volumes, and derived indicators — are sourced from binance_futures and are distinct from AMD’s underlying US equity quotes available on US exchanges.
The Moving Average Stack Uniformly Overhead
Every supplied moving average sits above the current contract price, forming a layered ceiling rather than scattered noise. The SMA 7 at $533.72, SMA 20 at $540.63, and SMA 50 at $573.82 are spaced in ascending order, with the longest-dated sitting more than $65 above current prices. The EMA 12 ($534.12) and EMA 26 ($549.46) mirror the same structure. A contract trading below its 7-day simple average while the 50-day sits over $65 higher reflects a sustained downward trend in the Binance instrument, not a brief consolidation. Re-engaging any of these averages would require meaningful follow-through buying, and crossing all of them would constitute a structural reversal rather than a routine recovery.
The Bollinger Band geometry reinforces the compressed position. With the upper band at $593.53, the middle band (SMA 20) at $540.63, and the lower band at $487.72, the total band width is approximately $105.81. The %B reading of 0.1978 indicates the contract sits roughly 20% of the way up from the lower band — hugging the downside boundary. The lower band at $487.72 lies about $21 below current prices and falls between the two supplied support levels.
Oscillators Near Oversold Without a Confirmed Turn
The 14-period RSI at 38.50 sits in the neutral zone per the supplied data, but is approaching the threshold where either a relief bounce or an accelerated decline becomes more probable. The more emphatic signal comes from the Stochastic oscillator: %K at 17.02 and %D at 13.62 are both below the conventional 20 oversold level. %K sits above %D — a configuration that can precede a bullish cross — but no such cross had confirmed at observation time. Positioning near an oversold Stochastic cross is a necessary but insufficient condition for a recovery; price structure and volume need to follow.
The MACD reading warrants a careful interpretation. Both the MACD line and the signal line stand at -15.3384, with the histogram at exactly 0.0000. This convergence means the momentum differential has closed completely from what was presumably a wider negative gap. The supplied label of “bearish momentum” remains accurate in absolute terms: the MACD level is deeply negative even if the divergence between line and signal has momentarily collapsed. The histogram turns constructive only if the MACD line crosses above the signal — an event that had not occurred at the time of observation.
Open Interest Builds While Funding Remains Neutral
Binance futures open interest rose 10.66% over the 24-hour window ending at the observation time, reaching 58,174.18 contracts with a daily notional value of $33,190,065 as reported by binance_futures. The supplied data characterises this as strong new position building. What makes the figure harder to interpret in isolation is the funding rate: the 8-hour settlement rate sat at exactly 0.0000% at observation time, meaning neither long nor short positions were paying a carry premium to the other side. Rising open interest alongside neutral funding indicates that new contracts were opened without the market pricing in a directional lean through the funding mechanism. A zero rate does not establish which side holds the newly built exposure.
Binance Account Positioning at 10:00 UTC
The Binance global account long/short ratio stood at 1.9078 at the 10:00 UTC observation on October 31, 2026, with 65.6% of global accounts long and 34.4% short. The top-trader cohort on Binance showed a wider skew at the same timestamp: a ratio of 3.0274, reflecting 75.2% long and 24.8% short. The 1-hour taker buy/sell ratio came in at 1.7243, with buy volume of 258 against sell volume of 150, indicating aggressive buying pressure in that window per the supplied data.
These metrics describe the distribution of Binance account positions and taker-side order flow within the Binance futures market at a single one-hour snapshot. They should not be read as a proxy for underlying AMD equity shareholder positioning, nor should the top-trader cohort be treated as equivalent to institutional investors in the conventional equity sense.
Bernstein’s $650 Target and the Server Business Thesis
On October 29, 2026, Bernstein analyst Stacy Rasgon was reported by TipRanks as maintaining an Outperform rating on AMD with a price target of $650. Rasgon’s view, as summarised in that report, favours AMD ahead of an upcoming earnings event, citing stronger growth prospects driven by the server business while flagging weak PC demand as a persistent drag. No specific earnings date was supplied; the timing of that catalyst is unknown from available evidence.
At the October 31 Binance contract price of $508.65, the $650 Bernstein target represents a 27.8% premium — a gap that reflects the distance between a medium-term equity valuation framework and the contract’s current level. Rasgon’s target applies to AMD’s underlying US-listed equity. The Binance tokenized contract tracks that equity but operates on a separate venue with its own session structure, futures mechanics, and funding dynamics.
Conditional Scenarios Around the Pivot
With the contract straddling the $508.41 pivot, two conditional paths emerge from the supplied levels. Neither constitutes a directional recommendation, and both are contingent on price structure following through.
To the upside, holding the $493.88 immediate support and recovering through the pivot would first encounter immediate resistance at $523.19 — a level corresponding to the intraday high of the prior session. A clean break above that would then face the strong resistance shelf at $537.72, which still sits roughly $25 below the SMA 7. Full moving average recovery would require considerably more work beyond that level.
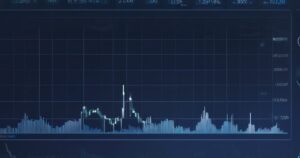
Hourly candlesticks (about 96 bars), same endpoint as our cryptocurrency price pages. Numbers below refresh from 1-minute klines.
More AMD news, AMD price prediction and analysis
Scenario — hold of pivot, recovery toward strong resistance; Direction: long; Entry: $508.65; Stop: $493.88; Target: $537.72; Reward/risk: 1.97:1 (before fees, slippage and gaps).
To the downside, a close beneath $493.88 would bring strong support at $479.10 into view. Given the ATR of $25.48, a single normal-range session is sufficient to cover the entire distance from current prices to that strong support zone. The Bollinger Band lower boundary at $487.72 sits within that range and provides an intermediate reference cluster.
Scenario — breakdown below immediate support; Direction: short; Entry: $508.65; Stop: $523.19; Target: $479.10; Reward/risk: 2.03:1 (before fees, slippage and gaps).
With RSI at 38.50 and the Stochastic in oversold territory, a technical bounce from current levels is consistent with the oscillator setup. That case requires a price close back above the pivot and resistance to carry any structural weight — the moving average alignment and the contract’s position relative to its Bollinger midpoint do not, on their own, support the assumption of a recovery.