AMD Price Prediction: Three $650 Buy Ratings Meet a Chart Buried Below Every Moving Average

Home
Latest reporting
Price forecast
Susquehanna, Jefferies, and Bernstein each carry a $650 Buy target on Advanced Micro Devices as of late October 2026, yet the Binance tokenized AMD contract settled its most recent session at $514….
Market analysis includes conditional scenarios, not assured price outcomes or investment advice. Check the data, assumptions and dates cited.
The Gap That Defines the Setup
The central tension in AMD’s market structure right now is a roughly 26% spread between where three major analysts say the stock belongs and where it actually trades. On October 30, 2026, Christopher Rolland at Susquehanna raised his price target from $620 to $650 and reiterated a Buy rating, citing expectations of stronger results and guidance driven by data-center demand, as reported by TipRanks. On the same date, Blayne Curtis at Jefferies maintained a $650 Buy target while projecting AMD to beat third-quarter revenue estimates at $13.5 billion and forecasting fourth-quarter revenue of $17 billion — also reported by TipRanks. Stacy Rasgon at Bernstein independently maintained a $650 Buy target, with the October 26 update referenced in Barchart’s October 30 article.
Three analysts, three identical $650 targets, four days. The Binance tokenized AMD contract settled its most recent session at $514.33, up 1.12% on the session and having traded as low as $505.96 intraday. A critical distinction applies before drawing any comparison to the analyst figures: this is a tokenized stock futures instrument on Binance, not a direct quote from U.S. equity markets. Both track the same underlying company, but contract pricing, session hours, and liquidity mechanics differ from the NYSE-listed share. Analyst price targets are not calibrated to Binance contract levels, and the roughly 26% spread maps the distance between the current contract price and the analysts’ fundamental view — it is not a near-term directional forecast.
A Moving-Average Stack That’s Entirely Overhead
The daily technical picture on the Binance AMD contract reads uniformly weak from a moving-average standpoint. Every tracked average sits above the $514.33 last price: the nearest is the 7-day SMA at $533.17, followed by the 12-day EMA at $531.20, the 20-day SMA at $536.87, the 26-day EMA at $546.92, and the 50-day SMA at $573.81. When a contract trades below its own 7-day average, it is not in a recovery — it is testing whether one can begin.
Momentum indicators present a mixed but broadly cautious picture. The MACD and its signal line are both at -15.7191, producing a histogram of exactly 0.0000, which means downside momentum has stalled rather than extended without yet showing any bullish crossover. The 14-period RSI at 40.26 occupies neutral-to-weak territory — below the 50 midline but well above classic oversold thresholds — and offers no standalone catalyst for a reversal.
The Stochastic oscillator provides the most constructive near-term reading in the set: %K at 23.46 sits above %D at 18.77, with both values in oversold territory below 25. A %K/%D crossover in this zone can precede a short-term lift, though within a bearish moving-average environment these signals have tended to produce rotations toward resistance rather than sustained trend changes.
The Bollinger Band %B at 0.2686 places the contract in the lower quarter of its current range, with the lower band at $488.17, the middle band at $536.87, and the upper band at $585.56. The contract is meaningfully closer to the floor of the range than its midpoint.
Key Levels and Conditional Scenarios
The pivot structure provides a clean reference grid. The pivot point at $511.68 sits just below the current price, with immediate support at $508.61 and strong support at $502.89. Overhead, immediate resistance is at $517.40 and strong resistance at $520.47 — both well below the nearest moving average at $533.17. Clearing even strong resistance would not return the contract to bullish moving-average territory.
The 14-period ATR of $24.85 reflects current daily volatility and serves as the practical noise filter for level-based analysis.
Two conditional scenarios arise directly from the supplied levels. Neither constitutes an investment recommendation, and stops do not guarantee execution prices.
Scenario: Support hold and rotation toward resistance; Direction: long; Entry: $508.61; Stop: $502.89; Target: $520.47; Reward/risk: 2.07:1 (before fees, slippage and gaps).
Scenario: Breakdown below strong support; Direction: short; Entry: $502.89; Stop: $511.68; Target: $488.17; Reward/risk: 1.67:1 (before fees, slippage and gaps).
Futures Positioning
Open interest on the Binance AMD contract stood at 58,359.77 contracts — a notional value of approximately $29.99 million — at the time of data collection, up 0.98% over the prior 24 hours. The 8-hour funding rate was 0.0000%, meaning neither the long nor the short side is currently paying a carry premium to hold positions, a neutral signal for directional conviction.
As of the 09:00 UTC observation on November 1, 2026, Binance global accounts were positioned 67.6% long versus 32.4% short, a ratio of 2.09. The top-trader cohort on Binance showed a more concentrated skew at 2.98 — 74.9% long against 25.1% short. The taker buy/sell ratio for the prior hour was 1.13, with buy volume of 253 units against sell volume of 224. These figures describe the positioning of specific Binance account cohorts within the futures contract; they do not represent the underlying AMD equity shareholder base or institutional flows in U.S. markets. The long skew is notable, but a contract that cannot reclaim its own 7-day SMA despite heavily long positioning indicates that buying pressure within the instrument has not yet been sufficient to break overhead supply.
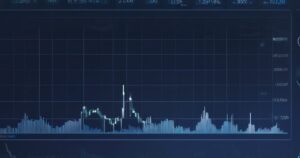
Hourly candlesticks (about 96 bars), same endpoint as our cryptocurrency price pages. Numbers below refresh from 1-minute klines.
More AMD news, AMD price prediction and analysis
Where Fundamentals and Technicals Diverge
Jefferies’ Blayne Curtis framed the $650 target around specific revenue expectations: $13.5 billion for the third quarter and $17 billion for the fourth, a sequential step-up that would represent meaningful data-center acceleration. Susquehanna’s upgrade from $620 to $650 and Bernstein’s maintained $650 are similarly grounded in demand expectations for AMD’s AI accelerator products, pointing to an identifiable growth driver rather than a static valuation call.
The timing of AMD’s Q3 earnings release is not confirmed in the available evidence, so no event date can be cited as an imminent catalyst. What the analyst framing does establish is that the gap between $514 and $650 is tied to a growth thesis that will be tested by actual reported results and forward guidance. A beat at or above the $13.5 billion Q3 projection, combined with Q4 guidance in line with the $17 billion figure Curtis cited, would reinforce the fundamental case for narrowing that gap. A miss or a guidance reduction would direct attention toward strong support at $502.89 and the Bollinger lower band at $488.17.
The technical picture is not aligned with the analyst case right now, and the contract’s position below every tracked moving average is the more immediate governing condition. Reclaiming the 7-day SMA at $533.17 would be the first concrete evidence that the balance between the two pictures is beginning to shift.