Bitcoin Bear-Market RSI Bottom ‘Will Happen Again’ in 2026, Says Trader

Bitcoin (BTC) should repeat history and put in a bear-market bottom when a classic indicator hits zero, a trader says.
Key points:
Bitcoin classic two-month stochastic RSI signals are valid this bear market, Max Crypto said.The bear market will be over once the indicator reaches zero again.RSI divergences provided advance notice of the BTC price rebound beyond $64,000 this month.
Bitcoin stochastic RSI bottom signal “will happen again”
In an X post at the weekend, Max Crypto went on record to forecast the end of the 2026 bear market when the stochastic relative strength index (RSI) hits a new swing low.
“Stoch” RSI is a derivative of RSI, a popular leading indicator, with a greater bias on recent price moves.
“Every time the 2M Stoch RSI had a bullish cross and dropped to 0, $BTC bottomed,” Max Crypto wrote in accompanying commentary.
“This happened in 2014, 2018, and 2022, and it will happen again.”
BTC/USD two-month chart with stochastic RSI data. Source: Cointelegraph/TradingView
Two-month stoch RSI measures 4.81, having dropped into its sub-30 “oversold” zone during March, data from TradingView confirms. Current levels were last observed just over three years ago.
Stoch RSI has already formed a focus for market participants this year, with daily moves previously drawing comparisons to the 2022 bear market.
In April, crypto trader Quantum Ascend described BTC price history as “playing out nearly perfectly.”
Bear-market RSI cues keep coming
Turning to traditional RSI data, traders continue to look for bullish cues as BTC/USD treads water above $60,000.
Related: BTC price bull market to begin in September? Five things to know in Bitcoin this week
On Sunday, trader and investor BitcoinHyper eyed a bullish divergence against the S&P 500.
At the start of June, daily RSI dropped to just 15, marking one out of just six of what trader Osemka later called “extremely powerful selling events.”
“There’s been one case where extreme $BTC RSI (1D at 15) failed to break the lows and only managed to sweep it. That was at the end of accumulation range in 2015,” he continued on Tuesday.
“I’m mentioning it now since we have also only swept the low on such powerful move down.”
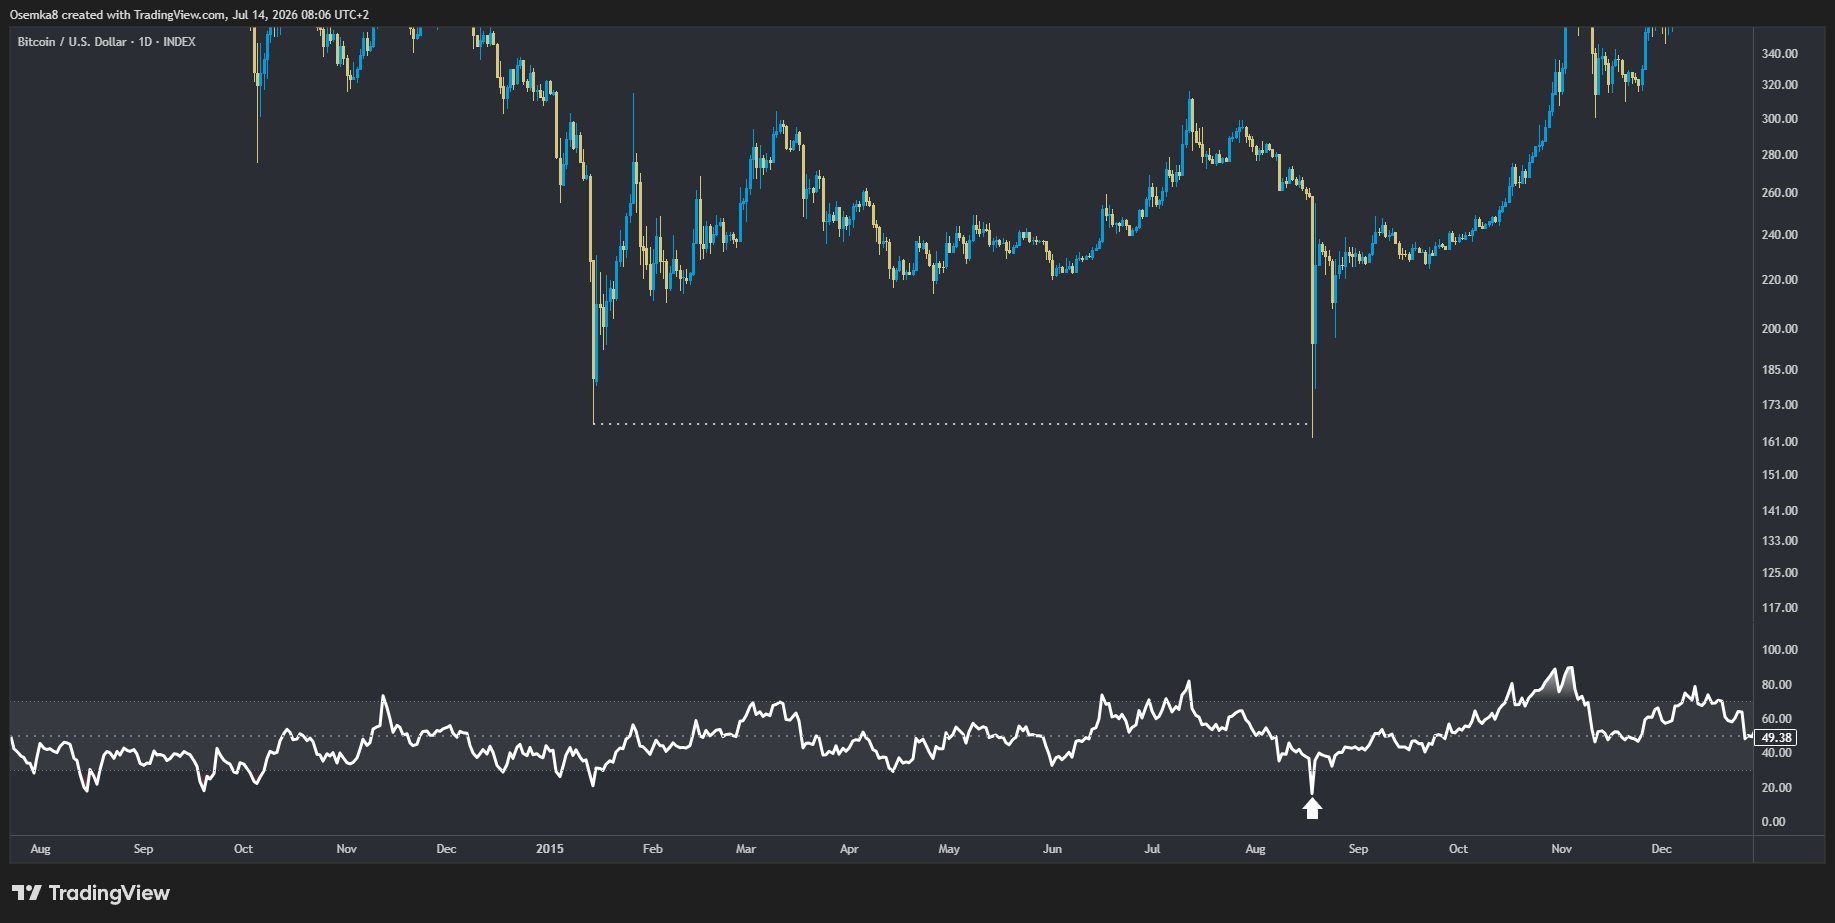
BTC/USD one-day chart with RSI data. Source: Osemka/X
Osemka implied that a deeper RSI retracement could still emerge, marking a price reversal in-line with previous bear markets.
Bitcoin’s return above $64,000 this month, meanwhile, came after bullish RSI divergences across multiple time frames.