Bitcoin Price Retreats From September Highs With $82.8K in the Crosshairs
Key Takeaways
Bitcoin’s price sits near $83,428 after retreating about 4.5% from its $87,374 high.Market data rates bitcoin’s daily setup bullish, while the 1-hour and 4-hour read bearish.Bitcoin’s price faces support near $82,800-$83,200, with $87,374 still the major overhead test.
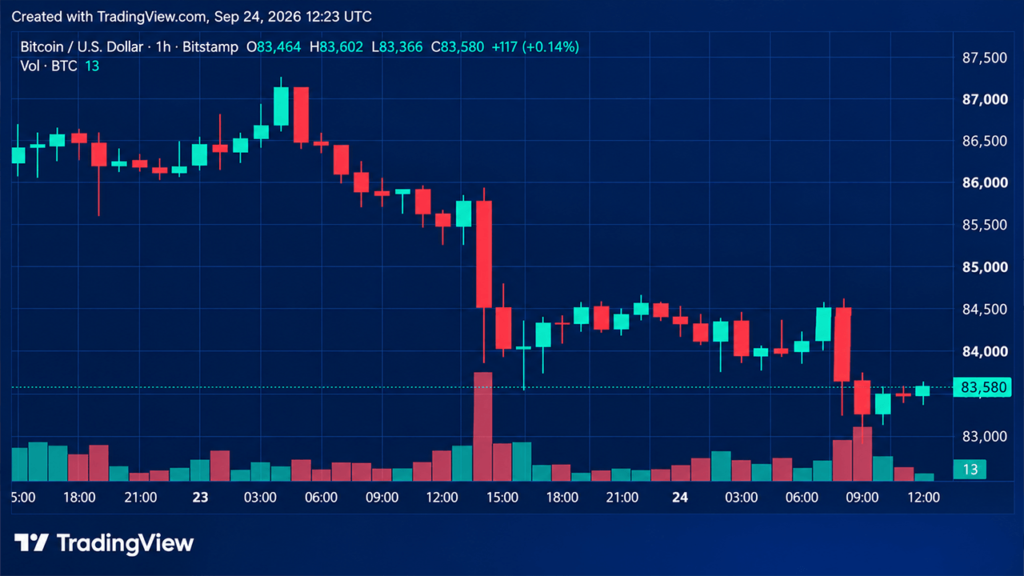
Bitcoin’s 1-Hour Chart Puts $83,000 Under the Microscope
Bitcoin’s price on the 1-hour chart shows the clearest short-term pressure after the run to $87,374 gave way to a stair-step decline characterized by lower highs. The price eventually reached roughly $83,000-$83,400, where a modest bounce developed from the current shelf, while Bitstamp’s order book showed size stacked in the low-$83,000s at the time of capture.
For now, short-term control remains with sellers as long as bitcoin stays beneath the mid-$84,000s. A sustained reclaim of that area would improve the immediate structure, while a clean break beneath the current bounce low would keep the pullback alive and place greater pressure on nearby support.
Bitcoin’s 4-Hour Chart Shows the Post-$87,374 Hangover
The 4-hour chart makes the recent reversal in momentum particularly clear. Bitcoin’s price climbed rapidly from the labeled $74,913 mid-September swing low to $87,374, but that vertical advance was followed by a sequence of lower highs and several red candles that carried bitcoin’s price back into the low-$83,000s.
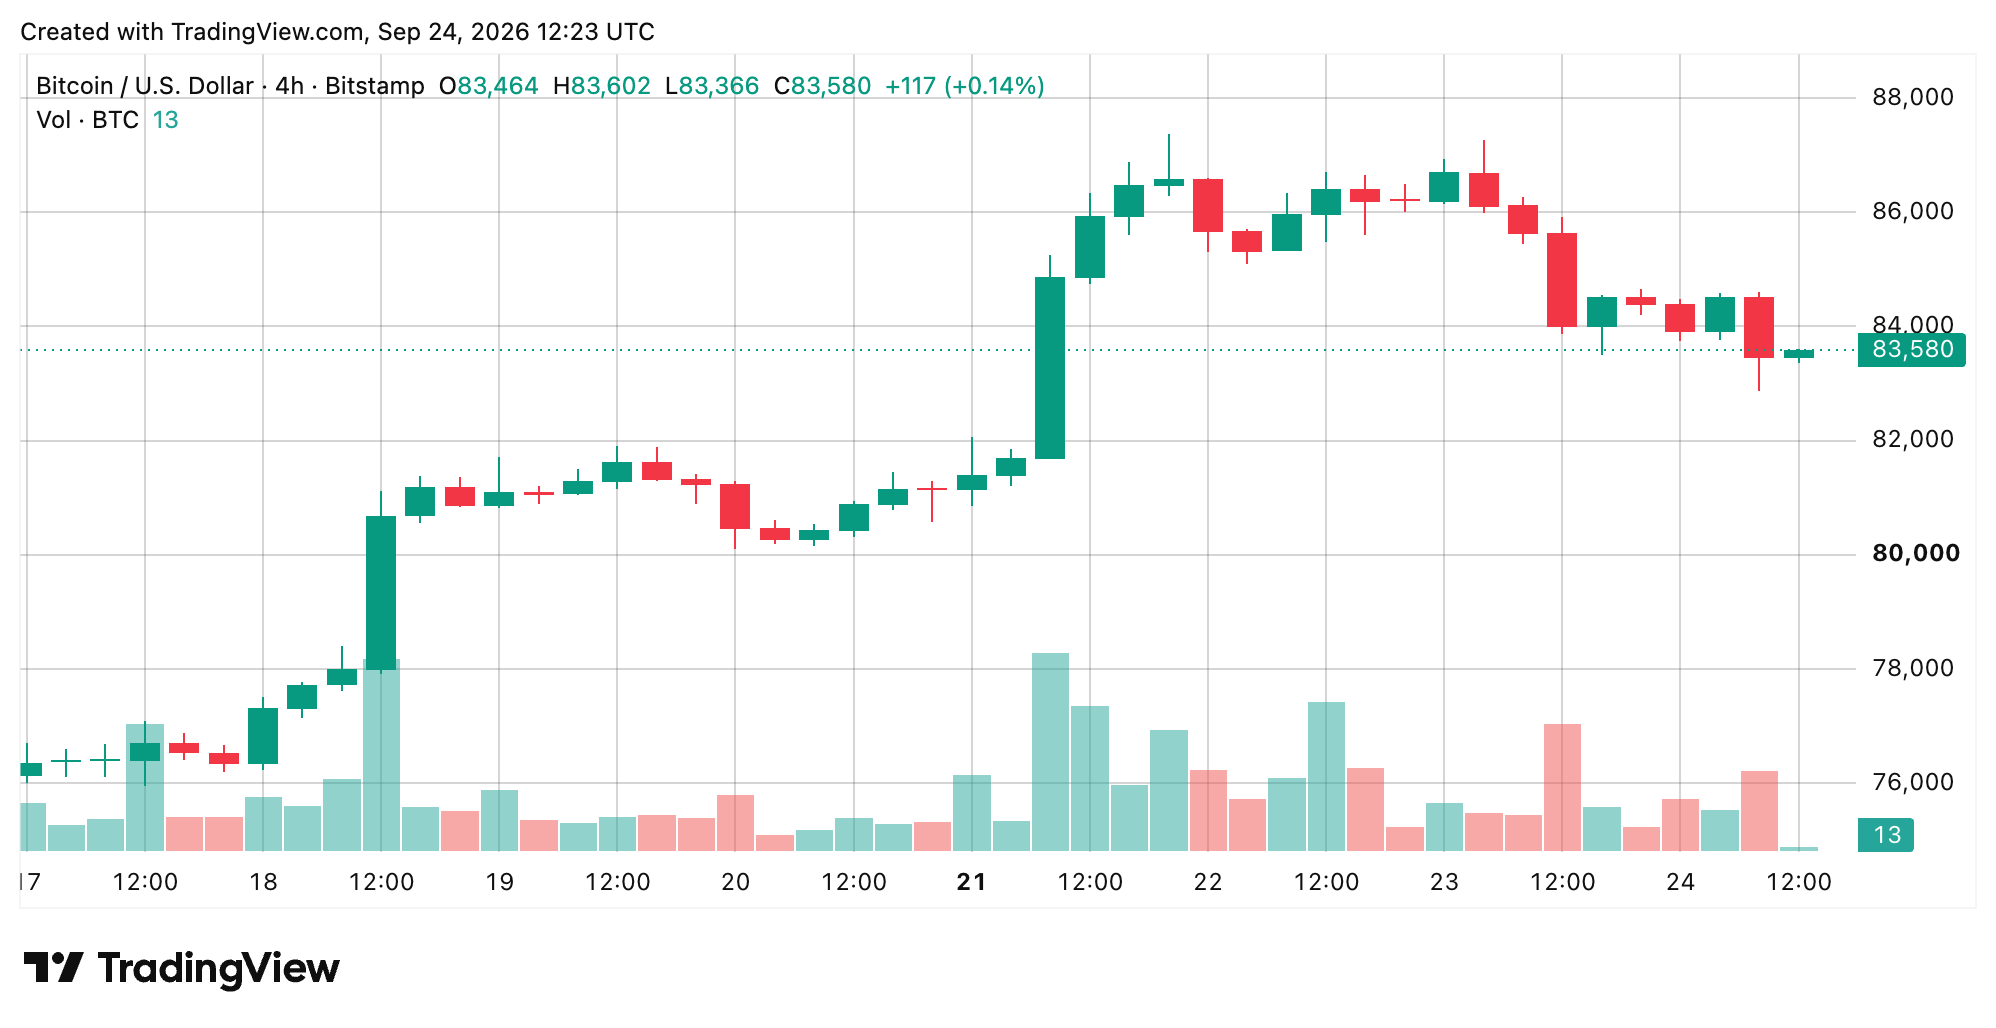
The latest candles show a small bounce from that dip rather than another impulsive move higher. The mid-$84,000s represent the first important reclaim area, while roughly $82,800-$83,200 serves as the immediate floor. Losing that zone would expose the mid-to-high $70,000s, the same territory from which bitcoin launched the previous leg toward $87,374.
Bitcoin’s Daily Chart Is Still Playing a Different Game
Zoom out to the daily chart and the picture changes considerably. Bitcoin’s broader structure traces a multi-month advance from the labeled $57,735 low to the recent $87,374 high, followed by the current pullback rather than a complete retracement of September’s massive advance.
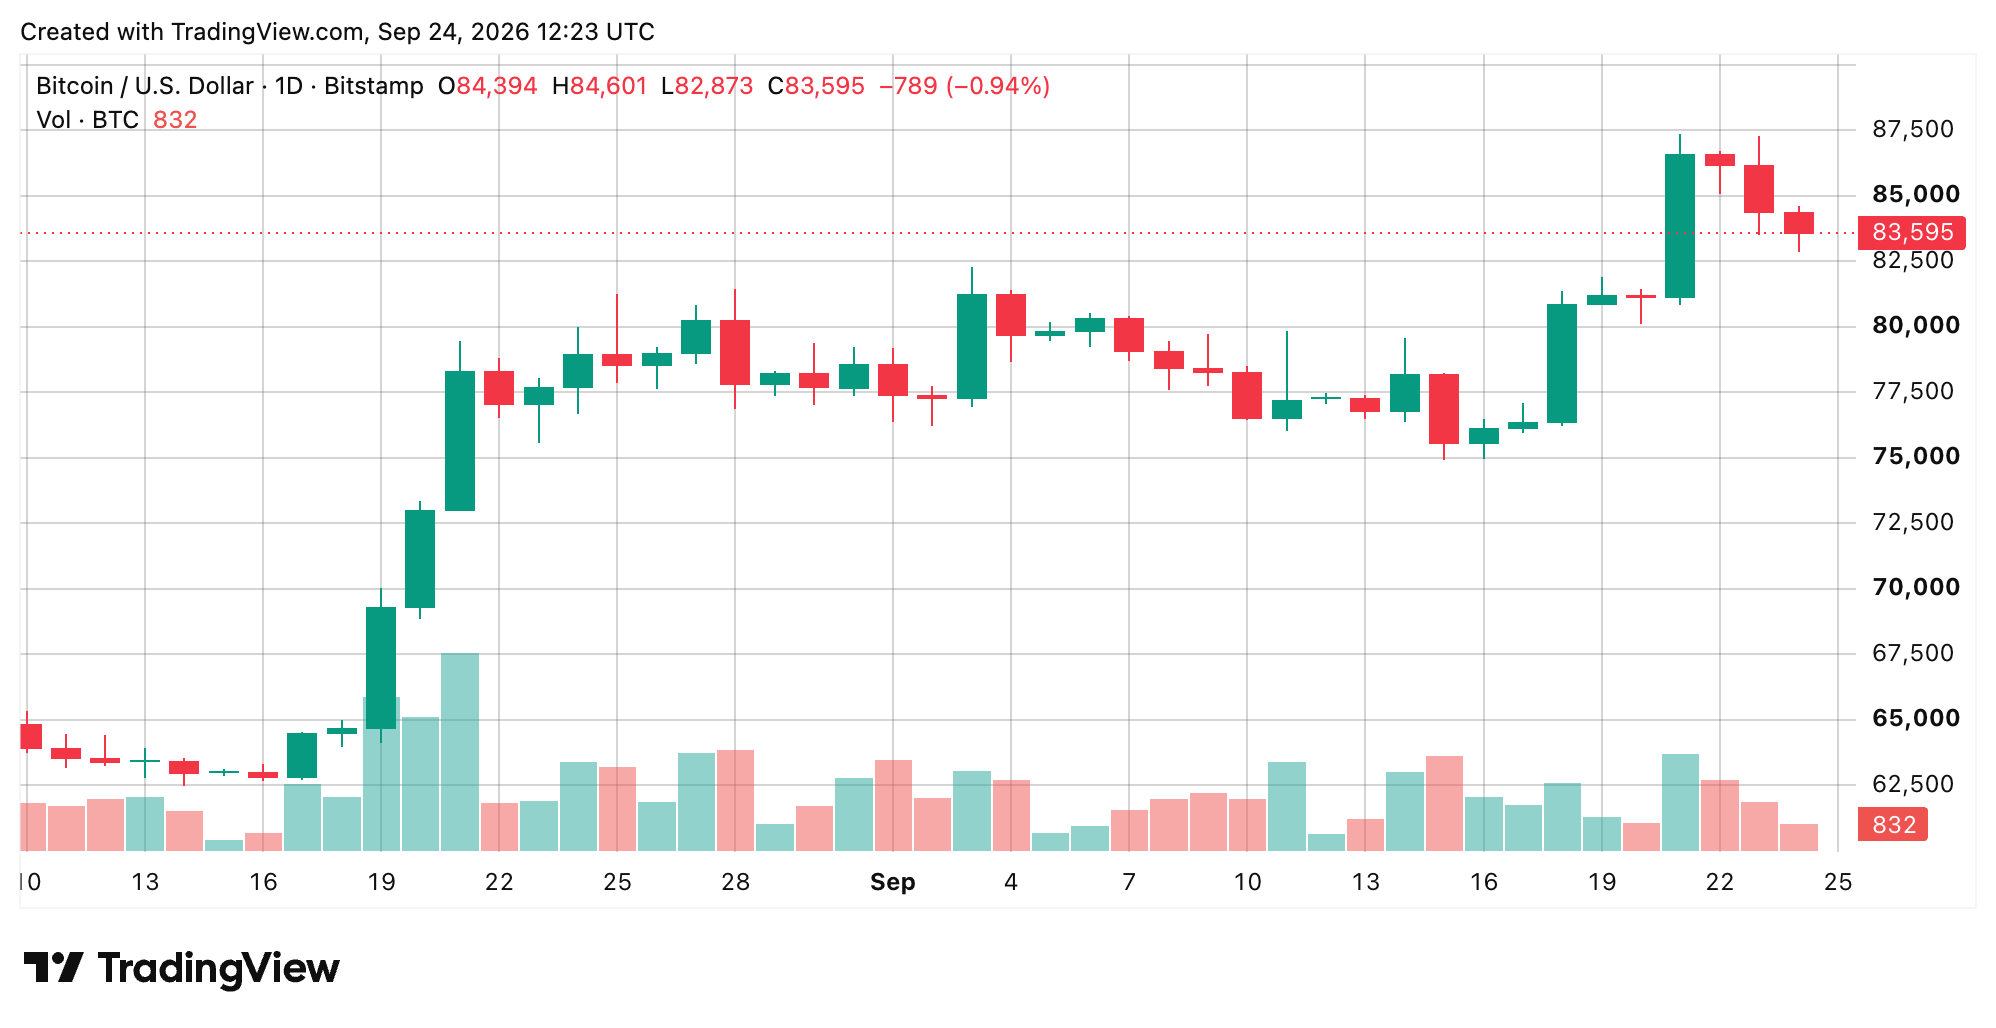
Prior congestion and the earlier bounce zone sit across the high-$70,000s to low-$80,000s, while $87,374 remains the nearest major overhead level. A daily close back through approximately $85,900-$87,400 would put that recent peak directly back in play. On the flip side, losing the current mid-$80,000 area and subsequently breaking through the low-$80,000s would place September’s upward impulse under considerably greater pressure.
Oscillators Show Just How Different the Timeframes Look
The oscillator board captures the tension between bitcoin’s broader trend and its short-term pullback. On the daily timeframe, the relative strength index (RSI) reads 62, stochastic %K sits at 78, the commodity channel index (CCI) is 109, the average directional index (ADX) stands at 44, the awesome oscillator (AO) is 4,822 and momentum is 5,255.
Moving average convergence divergence (MACD) registers 2,412, stochastic relative strength index fast (Stochastic RSI Fast) is 72, Williams %R is -32, bull bear power (BBP) is 4,436, and the ultimate oscillator (UO) is 62. The 4-hour readings are notably softer, with RSI at 47, stochastic %K at 17, CCI at -96, ADX at 37, AO at 621, momentum at -2,784, and MACD at 676. The 1-hour readings are weaker still, with RSI at 36, stochastic at 29, and MACD at -468.
Moving Averages Keep the Bigger Trend Intact
The moving averages (MAs) tell the other half of the story, particularly on the daily timeframe. The 10-period exponential moving average (EMA) stands at $82,185 and the 10-period simple moving average (SMA) at $81,195, placing both below the morning spot price of $83,428.53. From there, the EMA 20 sits at $80,277, SMA 20 at $79,697, EMA 30 at $78,698, and SMA 30 at $79,374.
Farther down the line, the EMA 50 is $76,076, SMA 50 is $74,907, EMA 100 is $73,027, SMA 100 is $69,071, EMA 200 is $73,818, and SMA 200 is $70,848. The Ichimoku Base Line sits at $81,144, the 20-period volume-weighted moving average (VWMA) at $79,798, and the 9-period Hull moving average (HMA) at $86,586. On the 4-hour timeframe, the shorter 10-, 20-, and 30-period averages remain above spot, while the 50-, 100-, and 200-period EMAs and SMAs remain below it.
Bull Verdict:
Bitcoin’s broader structure remains constructive above the low-$80,000s, and holding $82,800-$83,200 followed by a reclaim of $84,500 would put $85,876 and ultimately $87,374 back in play.
Bear Verdict:
Short-term momentum remains tilted toward sellers, and a decisive break beneath $82,800 would keep the correction moving, exposing $82,000, then $81,000-$81,500, with the high-$70,000s becoming vulnerable if that support fails.