Bitcoin Traders Prepare For ‘Huge Week’ As Fed Interest-Rate Decision Nears
Bitcoin (BTC) heads into the end of July juggling volatility catalysts as the Federal Reserve reacts to US inflation.
Key points:
The Fed will deliver its latest decision on interest rates as US bond yields spike, with markets seeing a September hike as likely. June PCE inflation is due on Thursday after hitting a three-year high of 4.1% last monthSigns of a shift in the equities uptrend places the focus on Bitcoin’s macro correlation.Whales exchange inflows cool by 44% since June
Markets remain split on rate outlook
Attention turns once more to the US Federal Reserve this week, with the Federal Open Market Committee (FOMC), chaired by Kevin Warsh, set to announce its latest interest rate decision on Wednesday, July 29.
A combination of geopolitical tensions and persistent inflation pressures has reshaped expectations for Fed policy and put the possibility of further rate hikes back on the table as the US 2-year Treasury yield climbed to 4.3% last week. The latest data from the CME Group’s FedWatch Tool currently sees a 31% chance of a hike this week, with a hike at the September meeting having odds as high as 50%.
Fed target rate probabilities (screenshot). Source: CME Group
These rate hike expectations were tempered slightly as oil prices dropped 8% in the early hours of Monday as the US and Iran paused strikes. Rate hike odds therefore shifted from 37.4% to 33.7%. Ongoing developments in the Middle East thus continue to introduce volatility into the macroeconomic outlook, even as PPI inflation data released earlier in the month came in below expectations.
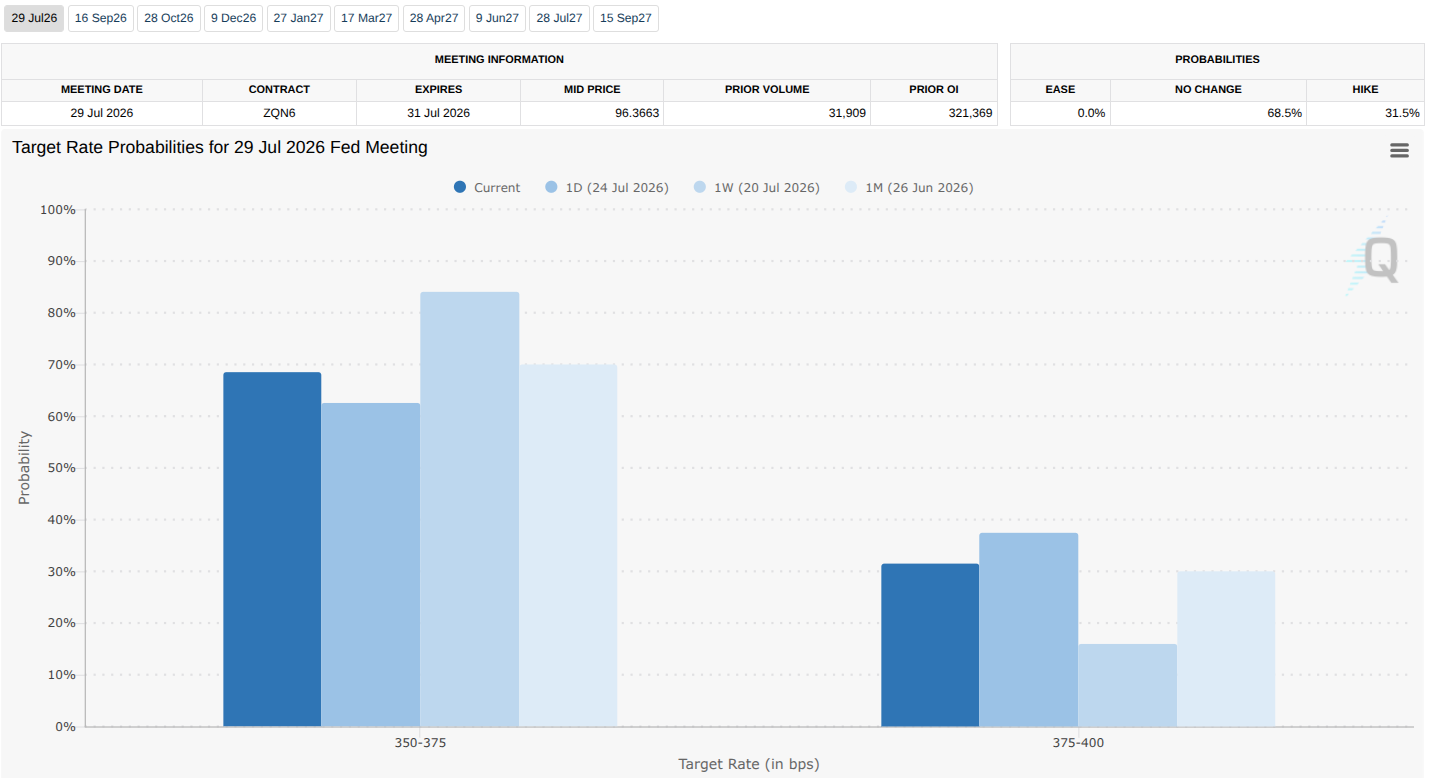
Fed target rate probability comparison for July FOMC meeting (screenshot). Source: CME Group
Commenting, trading resource Mosaic Asset Company also noted a pending upward breakout in 30-year bonds. Although the long end of the bond curve now plays a diminished role in funding the US government, this could notionally add to pressure on Warsh as he shapes his language at the post-FOMC press conference.
“The 30-year Treasury yield is also testing a key breakout level once again. In May, the 30-year yield saw a false break above the 5% level which has served as resistance since late 2023,” it summarized in the latest edition of its regular newsletter, The Market Mosaic.
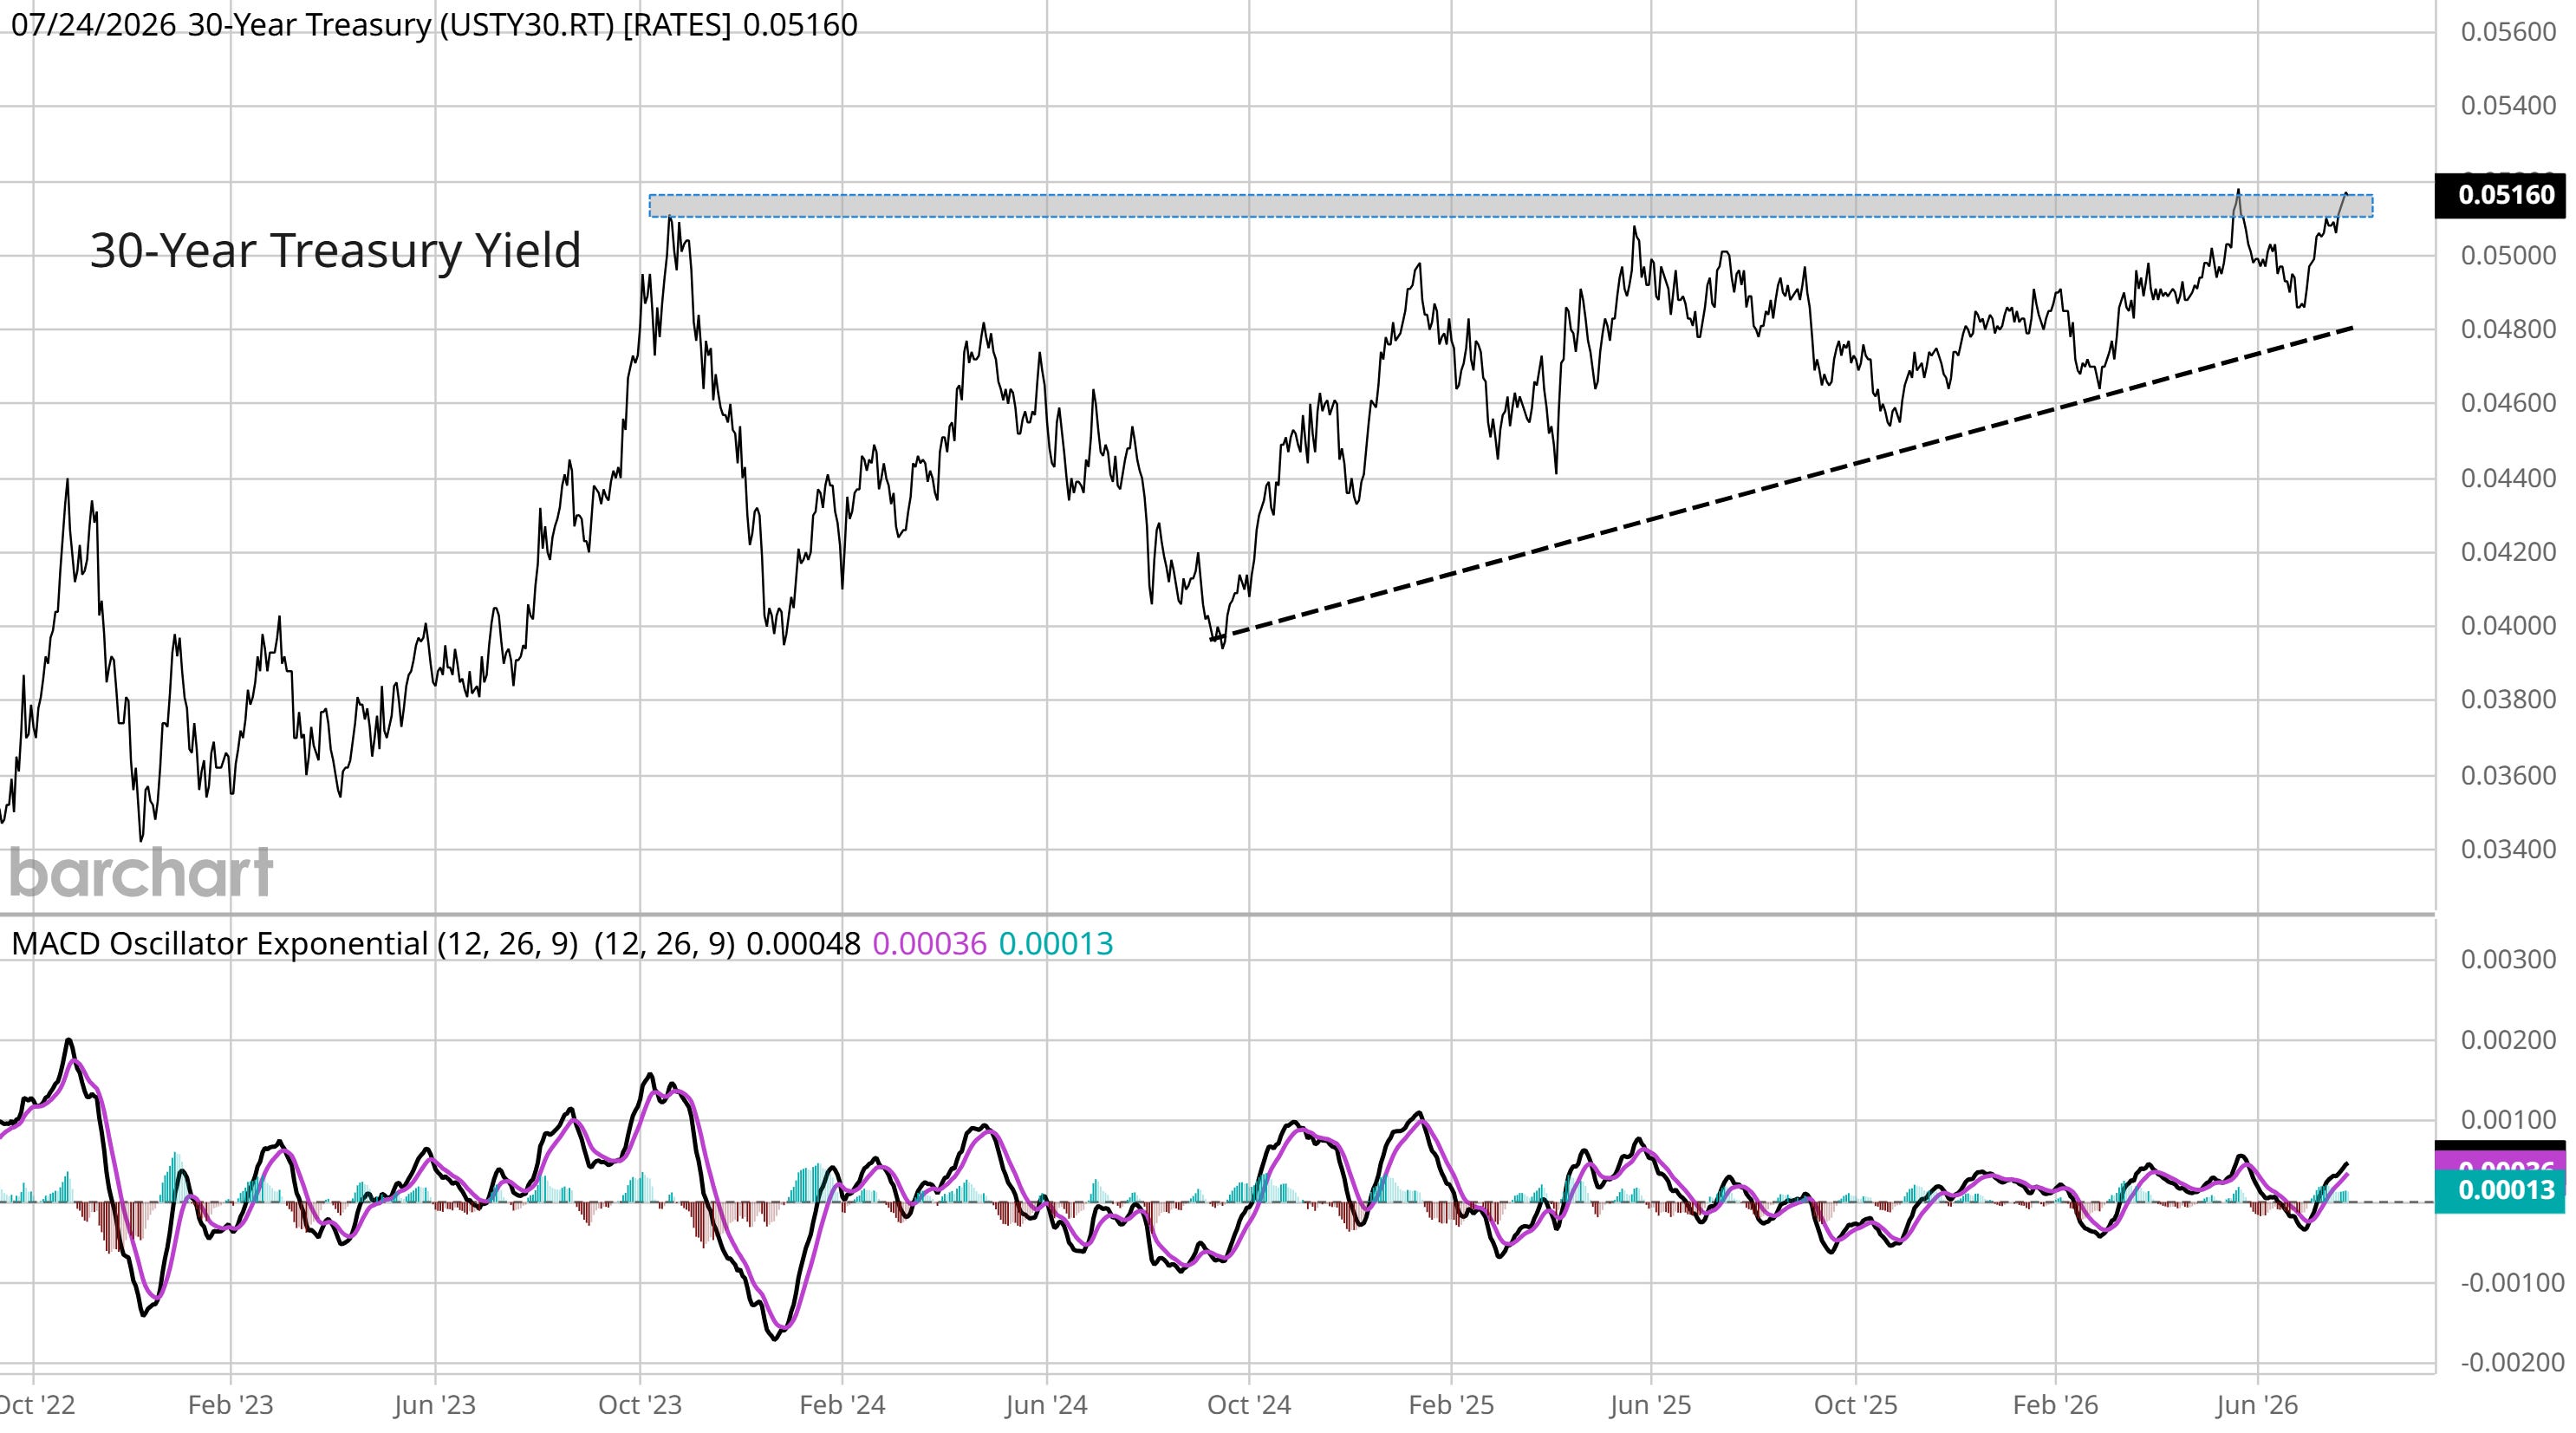
US 30-year bond-yield data. Source: Mosaic Asset Company
Even before the latest turmoil, new Fed chair Warsh had steered clear of dovish language on the economy and kept his post-FOMC statement and press conference notably brief.
“Inflation remains elevated relative to the Committee’s 2 percent goal, in part reflecting supply shocks that have driven price increases in certain sectors, including energy,” he said at the time.
PCE inflation seen falling from three-year high
Beyond the FOMC, markets will be watching the Personal Consumption Expenditures (PCE) index on Thursday for fresh signals over the impact of the US-Iran war on inflation trends. The June print of the index, currently sits at three-year highs.
PCE volatility can have a snap impact on risk-asset performance as traders reprice potential Fed reactions. June’s release coincided with Bitcoin dropping to macro lows around $58,000.
Prefacing its latest analysis, the International Monetary Economics Network (IMEN) predicted that PCE would be moderately lower compared to May’s 4.1% year-on-year tally. “U.S. inflation: We currently expect June PCE inflation to be 3.7% year‑over‑year,” it wrote on X.
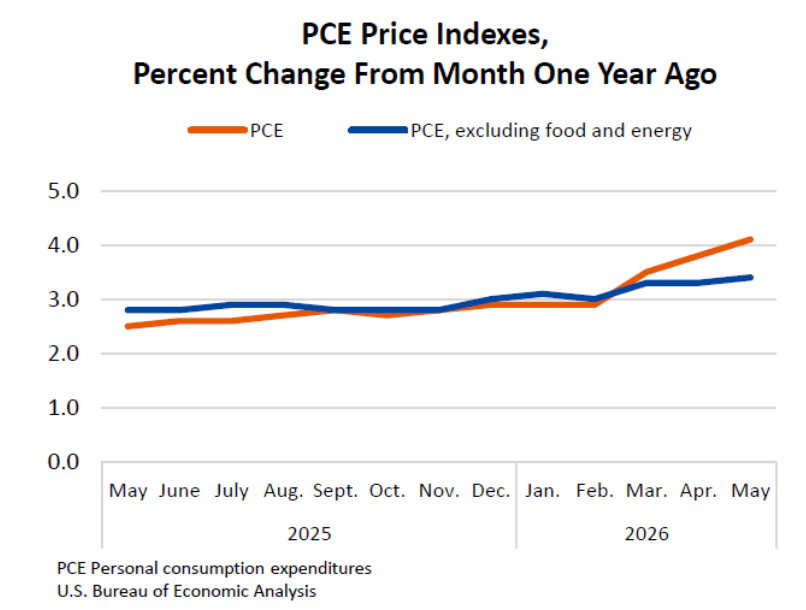
US PCE inflation data (screenshot). Source: Bureau of Economic Analysis
Correlation between Bitcoin and equities remains absent
On higher timeframes, correlations between Bitcoin and major equity indices have largely disappeared. Data from TradingView currently puts the daily correlation between BTC/USD and the S&P 500 with a 20-week loopback window as practically absent, at its lowest levels since March. Against the tech-heavy Nasdaq Composite Index, meanwhile, its current correlation coefficient of 0.11 was last observed in mid-February. While correlations on the weekly timeframe move slowly, bearish geopolitical and macro events have the potential to make the two asset classes move in lockstep again.
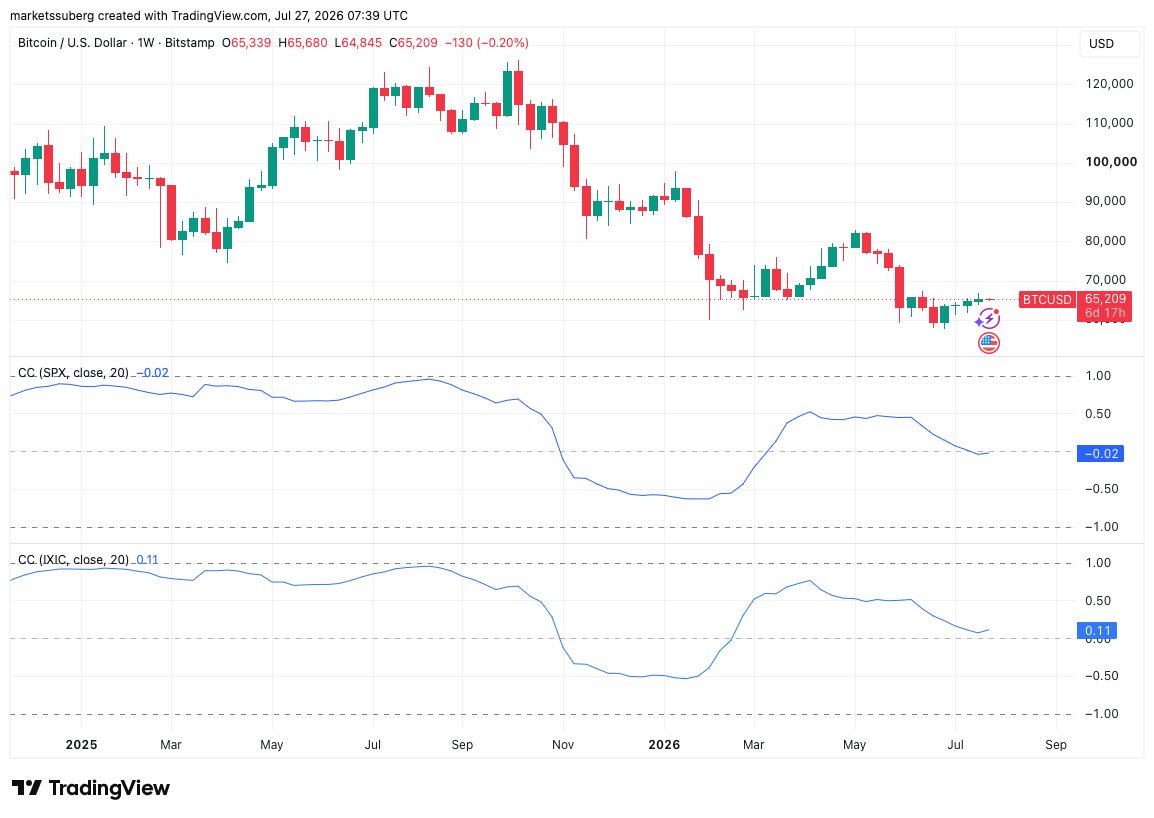
BTC/USD one-week chart with rolling 20-week stocks correlation. Source: Cointelegraph/TradingView
For now, corporate earnings in the US have continued to surpass expectations. However, given the historically high valuations, this is unlikely to shield the market from potential pullbacks. Several major US tech stocks saw significant drawdowns last week. The Magnificent 7 falling by an aggregate 5.3% through Friday after $GOOGL and $TSLA had already suffered sell-offs earlier in the week.
In spite of this, “Alphabet, $GOOGL , is the single largest margin contributor after significantly beating earnings estimates,” the Kobeissi Letter commented on the topic at the weekend.
“Meanwhile, 86% of reporting S&P 500 firms have so far beaten EPS estimates, while 80% have exceeded revenue expectations. AI is driving historic earnings growth.”
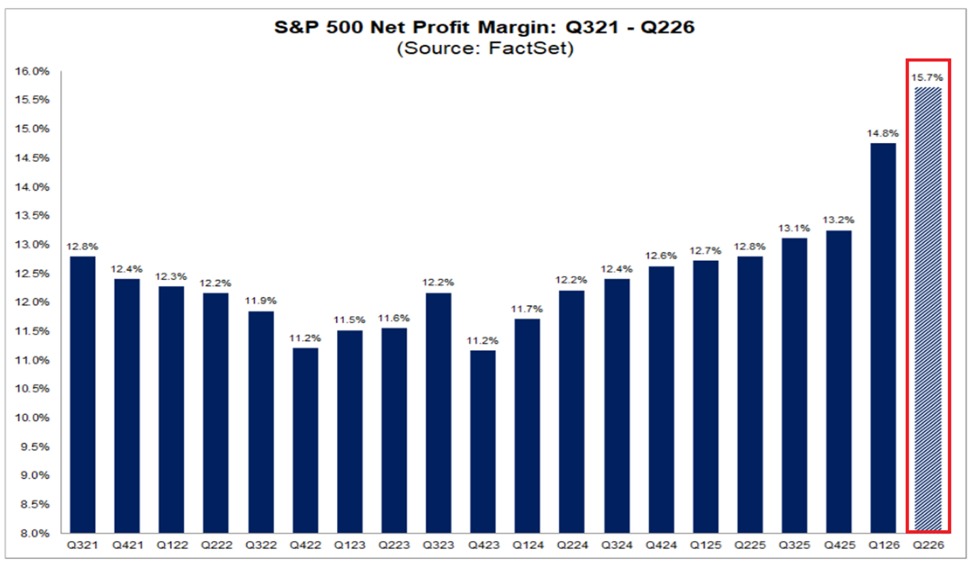
S&P 500 net profit-margin data. Source: The Kobeissi Letter on X.com
Mosaic Asset Company highlighted the risks that the rate environment may exert on US equities.
“Rising rates across the yield curve could keep pressuring stock prices, where indexes like the S&P 500 and Nasdaq peaked in early June and are now losing key support levels. At the same time, market breadth is deteriorating while the backdrop for seasonality is transitioning from a bullish tailwind to bearish headwind. Seasonality during mid-term election years also tends to produce lower average returns and larger drawdowns.”
With these emerging hurdles, the S&P 500 is at risk of losing its bullish setup altogether, Mosaic warns.
“The S&P already lost one key support level with the 50-day moving average (MA – black line). If trendline support in the triangle gives way, that could set up a test of the 200-day MA (green line) that’s currently near the 7,000 level (or 5% downside from current levels),” it added alongside an explanatory chart.
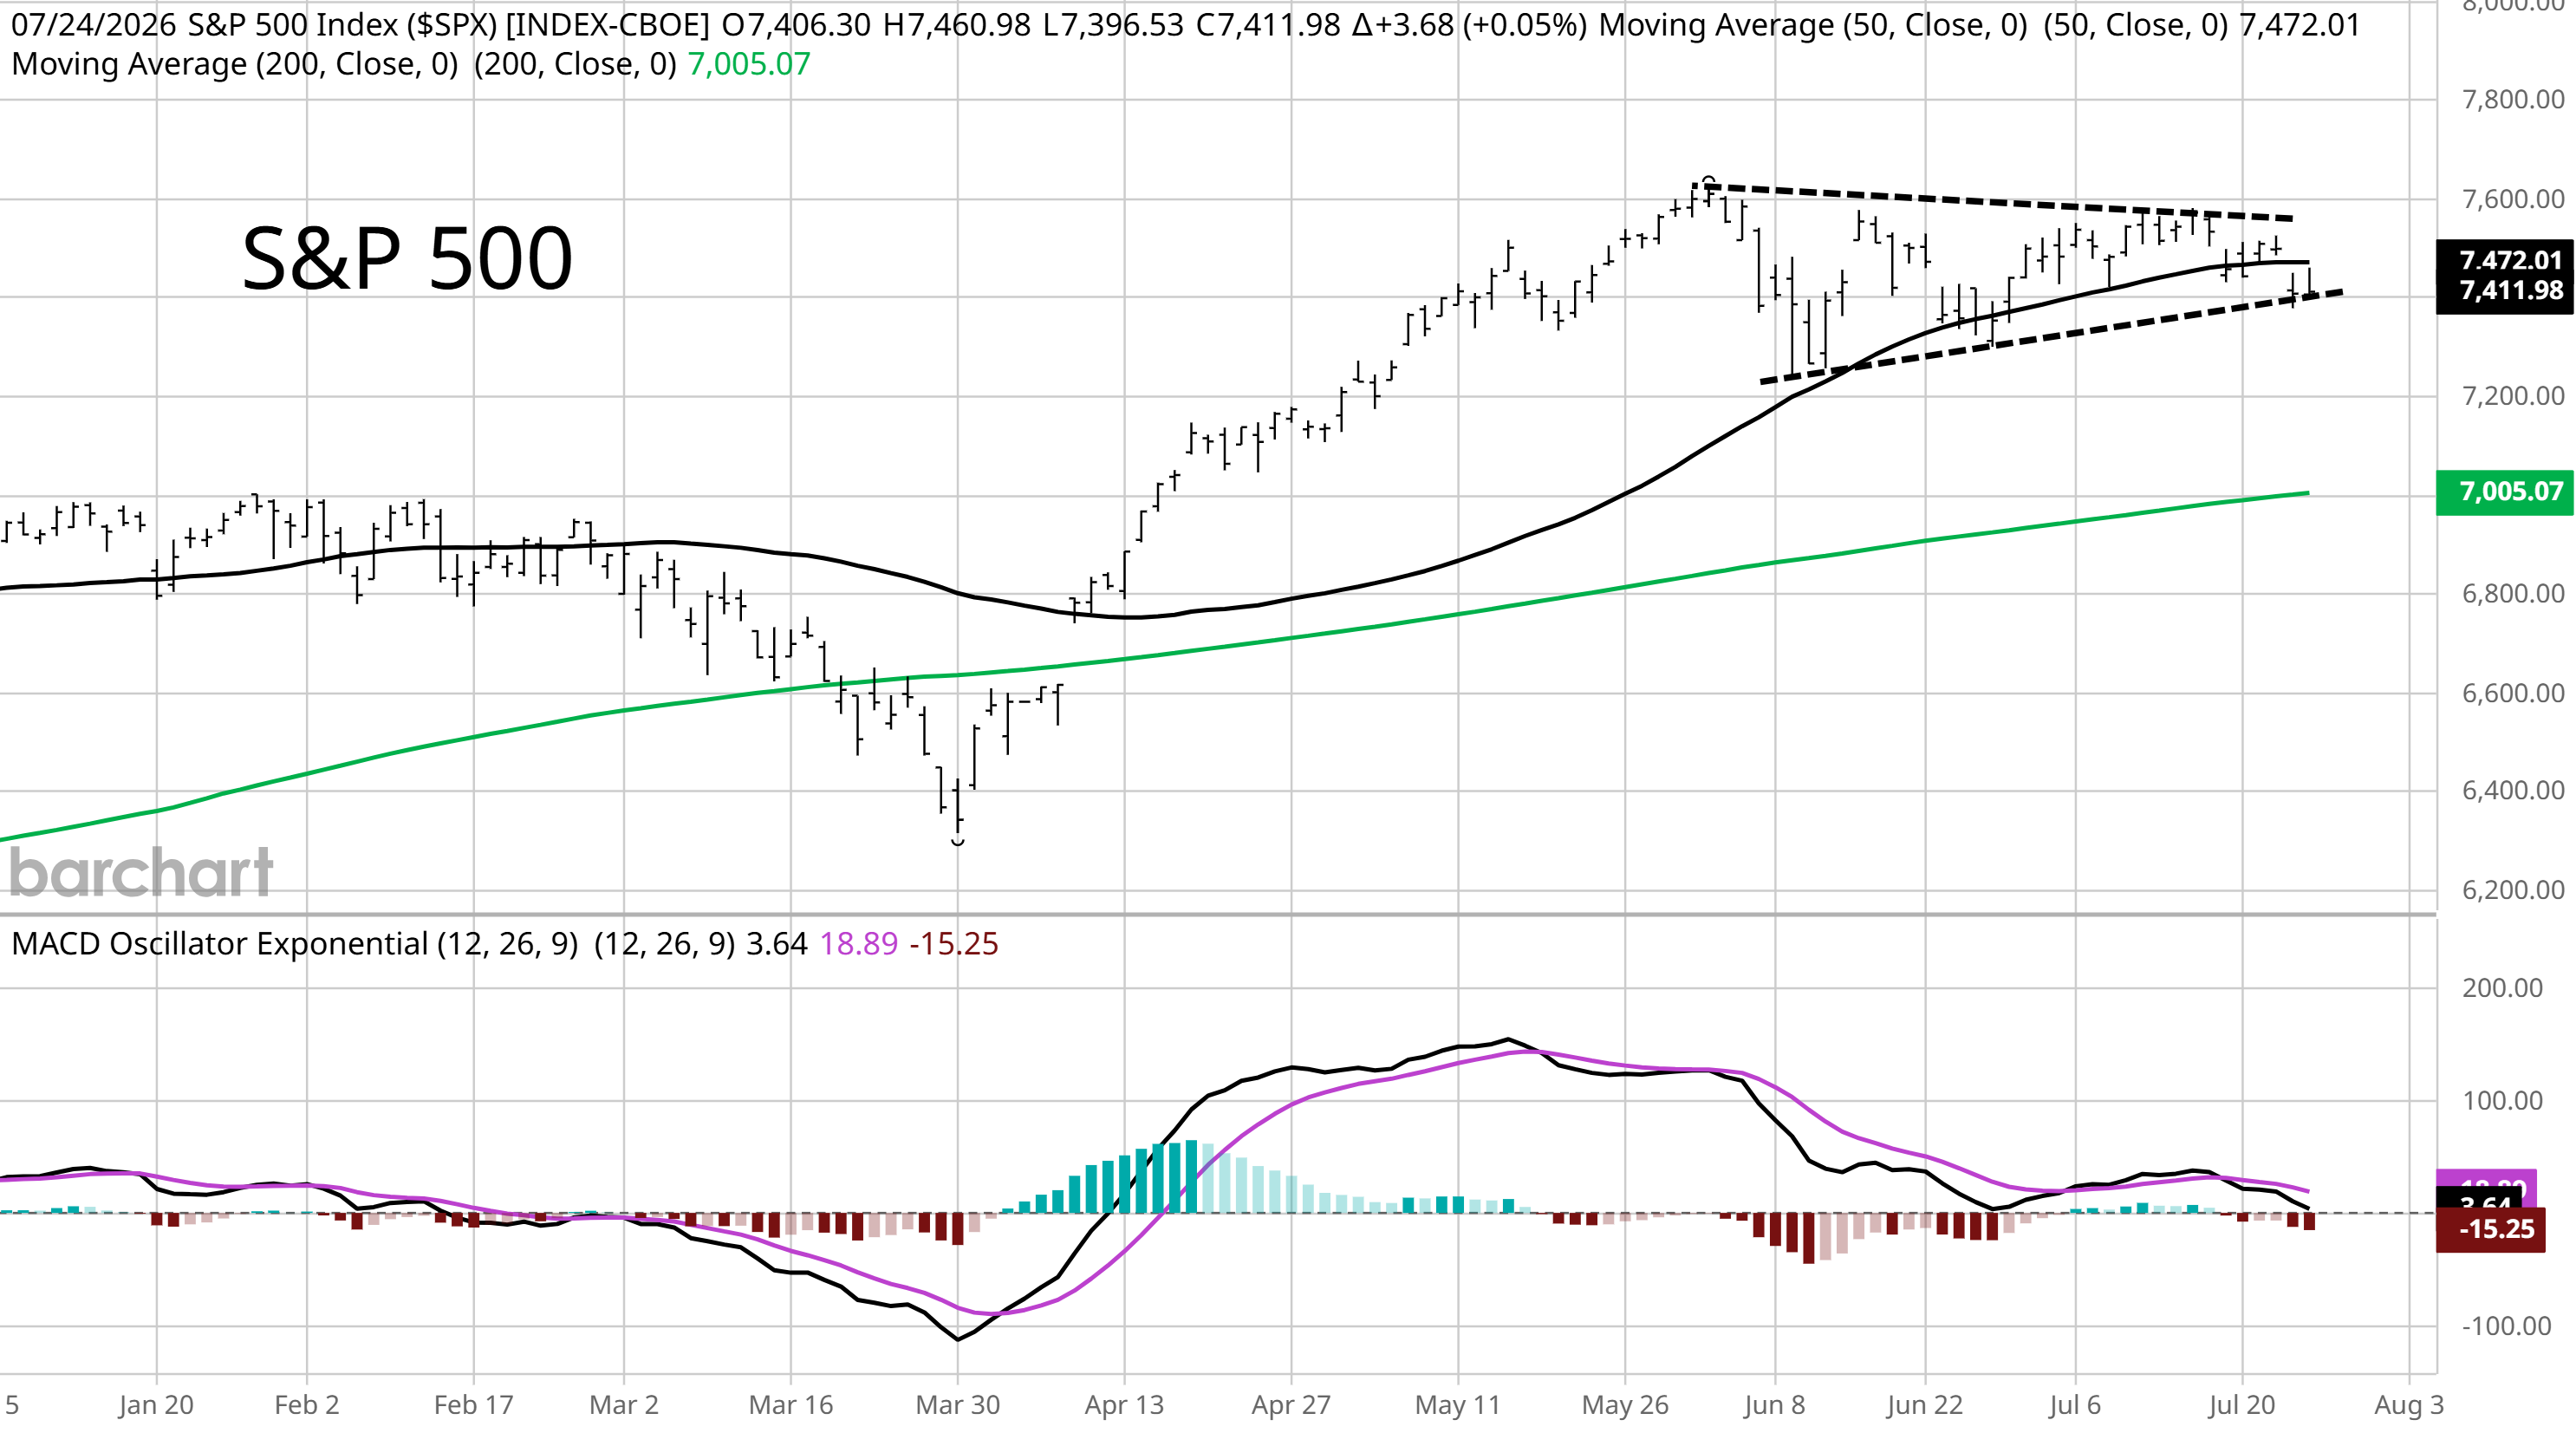
S&P 500 data. Source: Mosaic Asset Company
On shorter time frames, the picture remains fluid, with a pause in hostilities between the US and Iran providing a bullish impulse across risk assets. US WTI crude oil dropped as low as $83 per barrel to start the week, having previously eyed $95.
“The market is beginning to price-in a peace deal again,” Kobeissi responded.
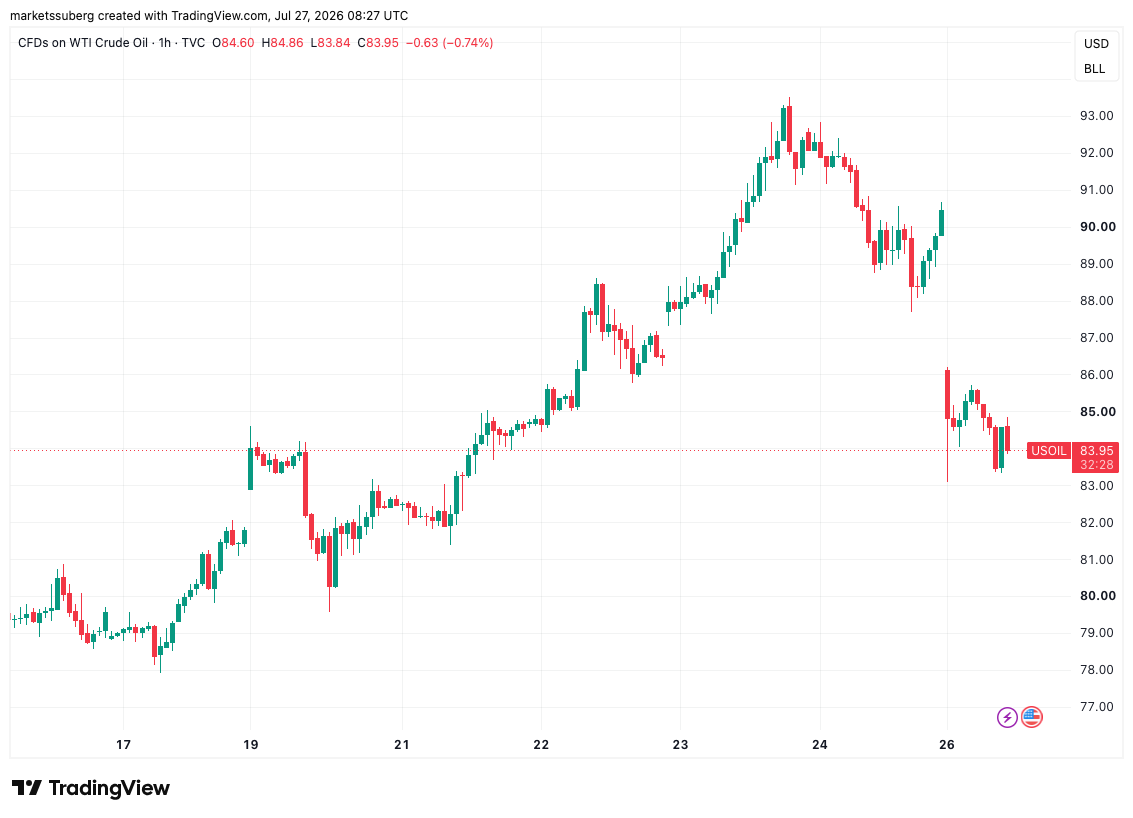
CFDs on US WTI crude oil one-hour chart. Source: Cointelegraph/TradingView
“Boring” BTC price range tests 50-month trend line
Bitcoin went on to seal new local highs after Sunday’s weekly close, reaching $65,680 on Bitstamp. Still in a familiar range, BTC/USD battled its 50-month exponential moving average (EMA) trend line, having previously flipped it to resistance in a copycat move from the 2022 bear market.
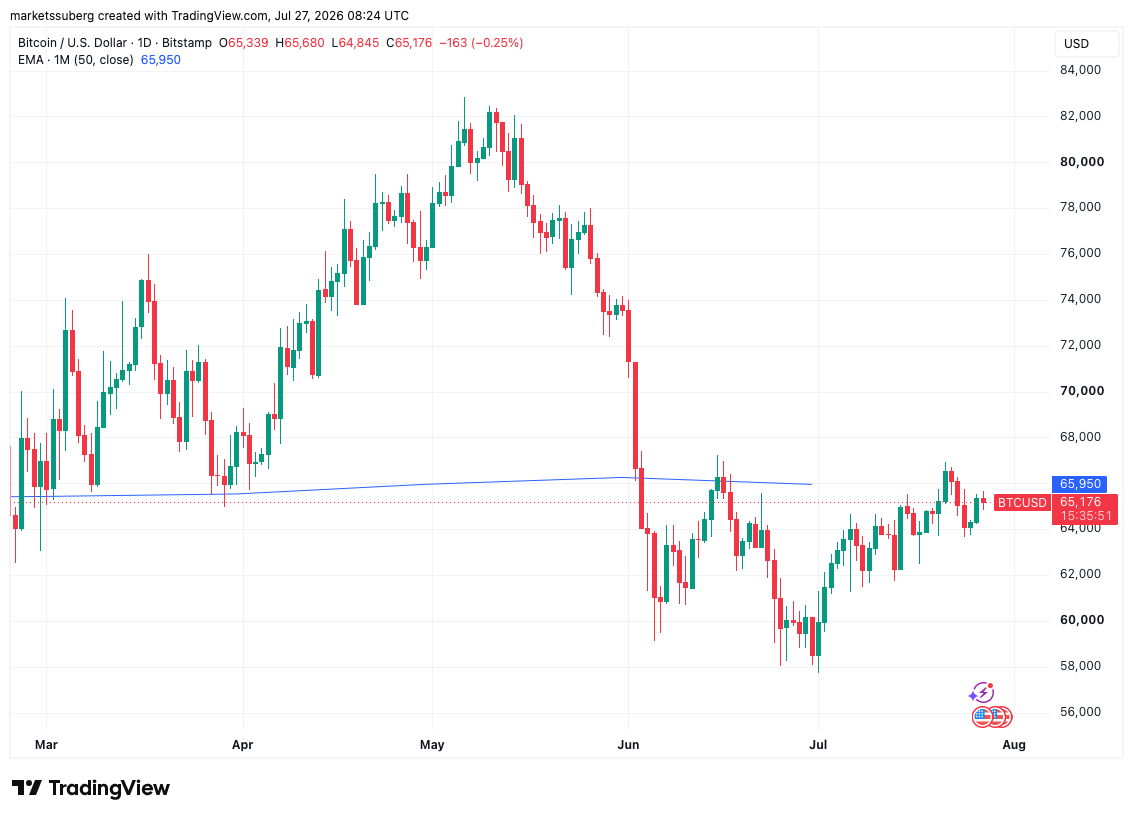
BTC/USD one-day chart with 50-month EMA. Source: Cointelegraph/TradingView
Commenting on the current market setup, trader and analyst Rekt Capital flagged resurgent sell-side pressure.
“The more seller-dominant the volume becomes while Bitcoin is at resistance, the greater the chances for a rejection from here,” he warned X followers on Sunday.
Rekt Capital brought the 200-week simple moving average (SMA) into the equation, describing price as “sandwiched” between it and its 50-month counterpart.
“Continued price compression here is unsustainable and will eventually force major volatility,” he forecast.
“And if the seller volume keeps coming in at this rate, then there’ll likely be a breakout on seller volume to precede a rejection from this local resistance area.”
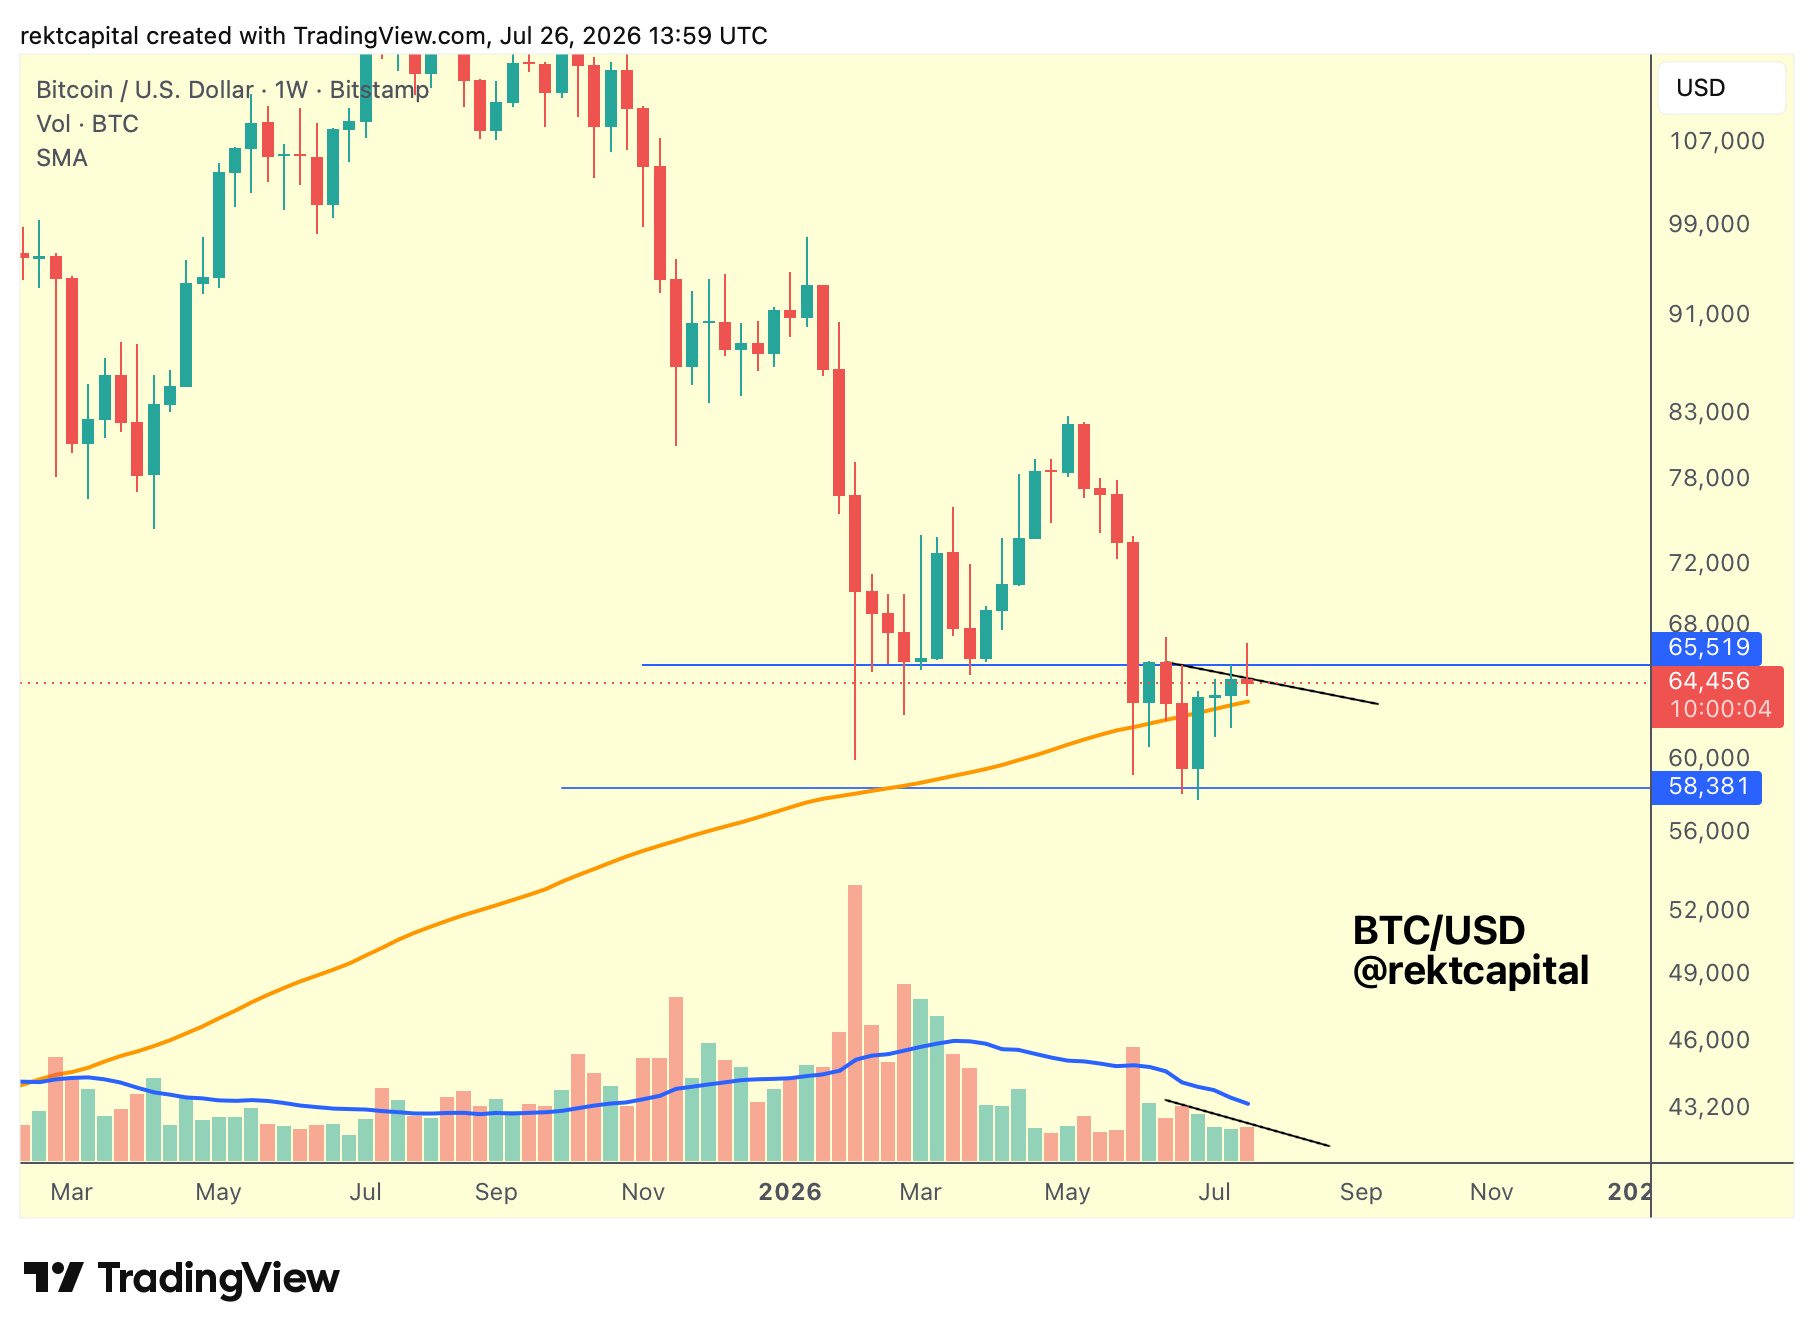
BTC/USD one-week chart. Source: Rekt Capital on X.com
Binance whale inflows nearly halve since mid-June
Commenting on the FOMC meeting and its impact on crypto markets, onchain analytics platform CryptoQuant sees a potential knock-on effect for sell-side pressure on major exchanges.
Related: BTC supply in profit eyes 60%, but analysis hints recovery may ‘roll back over’
According to their data, BTC inflows from whales to Binance, have dropped by up to 44% since June 12, while retail inflows fell 22%.
“This leaves retail inflows at roughly twice the level of whale inflows, with a gap of $3.9 billion,” contributor Amr Taha wrote in a blog post on Monday.
“The divergence suggests that the composition of BTC transfers into Binance has shifted: retail participants are currently significantly more active than whales in sending BTC to the exchange.”
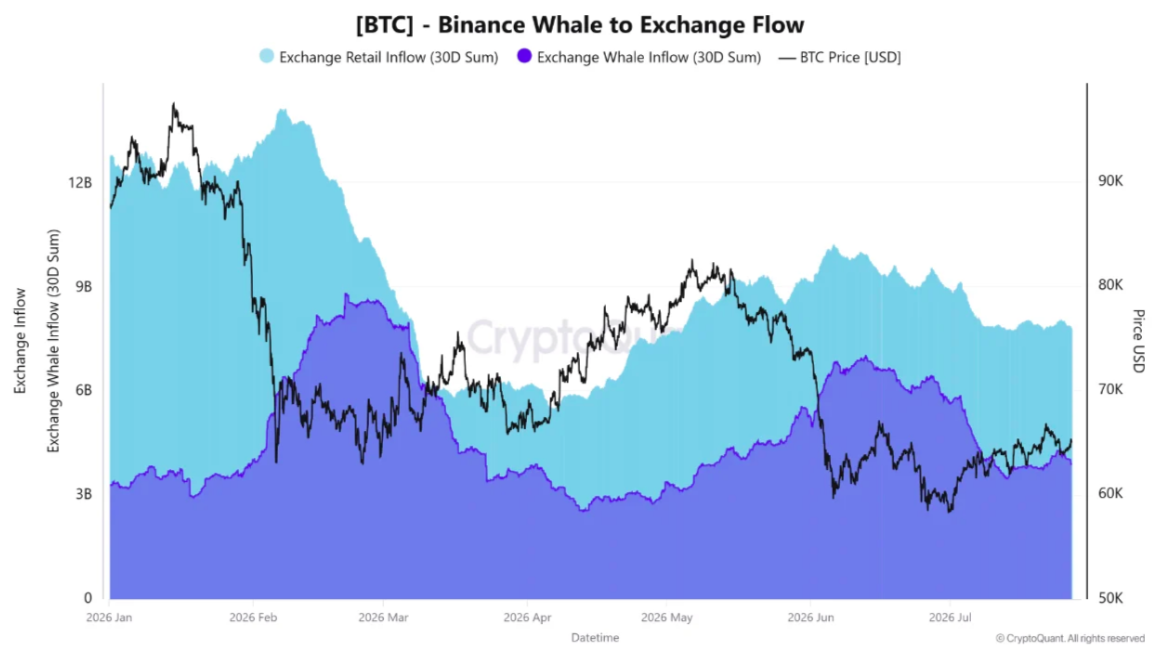
Bitcoin whale inflows to Binance (screenshot). Source: CryptoQuant
Taha described the FOMC meeting as a “major macro catalyst” that could reshape the approach of all investor cohorts to the market.
“With retail inflows now running at 2x whale inflows, Wednesday’s Fed decision could provide an important test of whether the current divergence between the two BTC cohorts persists or begins to converge,” he concluded.
As Cointelegraph reported, Binance saw single-day withdrawals of over 9,000 BTC last week.