Bitcoin’s Price Is Sitting on Support After a Brutal $79K Rejection
Key Takeaways
Bitcoin’s price tests $76,000-$76,700 support after rejecting the high-$79,000 range.The indicator tape shows BTC oscillators with 2 bearish signals, 8 neutral and 1 bullish signal on Sept. 15.Bitcoin’s moving averages split 7 sell and 7 buy, making $76,000 the key level.
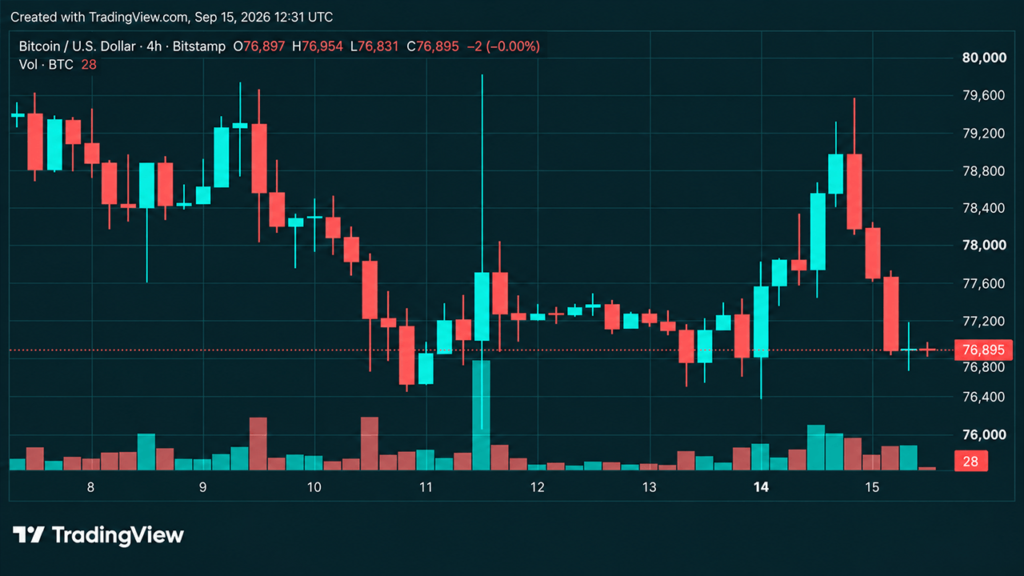
Bitcoin’s 1-Hour Chart Puts $76,600 in the Spotlight
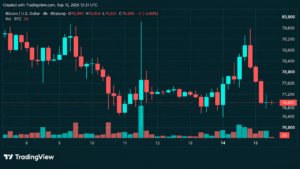
The 1-hour chart is where the pressure looks most immediate. Bitcoin’s price range has been working lower after rejecting the high-$79,000 area, with the visible Sept. 8 onward range stretching from roughly $79,925 down to $76,640. A sharp drop and recovery played out around Sept. 11-12, but another rejection followed around Sept. 14-15, leaving BTC back in the mid-$76,000 zone with only a small bounce appearing at the chart’s right edge.
Intraday volume also expanded during the larger declines, giving those bearish moves more weight. The $76,640-$76,682 cluster is therefore doing a great deal of work as nearby support. A recovery through roughly $77,500-$77,800 would improve the short-term picture, while $78,500 stands as a more meaningful hurdle. Below roughly $76,500, the setup deteriorates further and exposes the $75,500-$76,000 region.
The 4-Hour Chart Carries the Clearest Warning
Zooming out to four hours does not exactly let the bulls off the hook. Bitcoin’s price rallied from a labeled low near $62,470 into the $82,281 area before falling into a multi-week period of chop and gradual weakness. The current sequence includes lower highs and lower lows, and BTC’s rejection around $79,000-$79,500 effectively erased nearly all of the Sept. 14 advance.
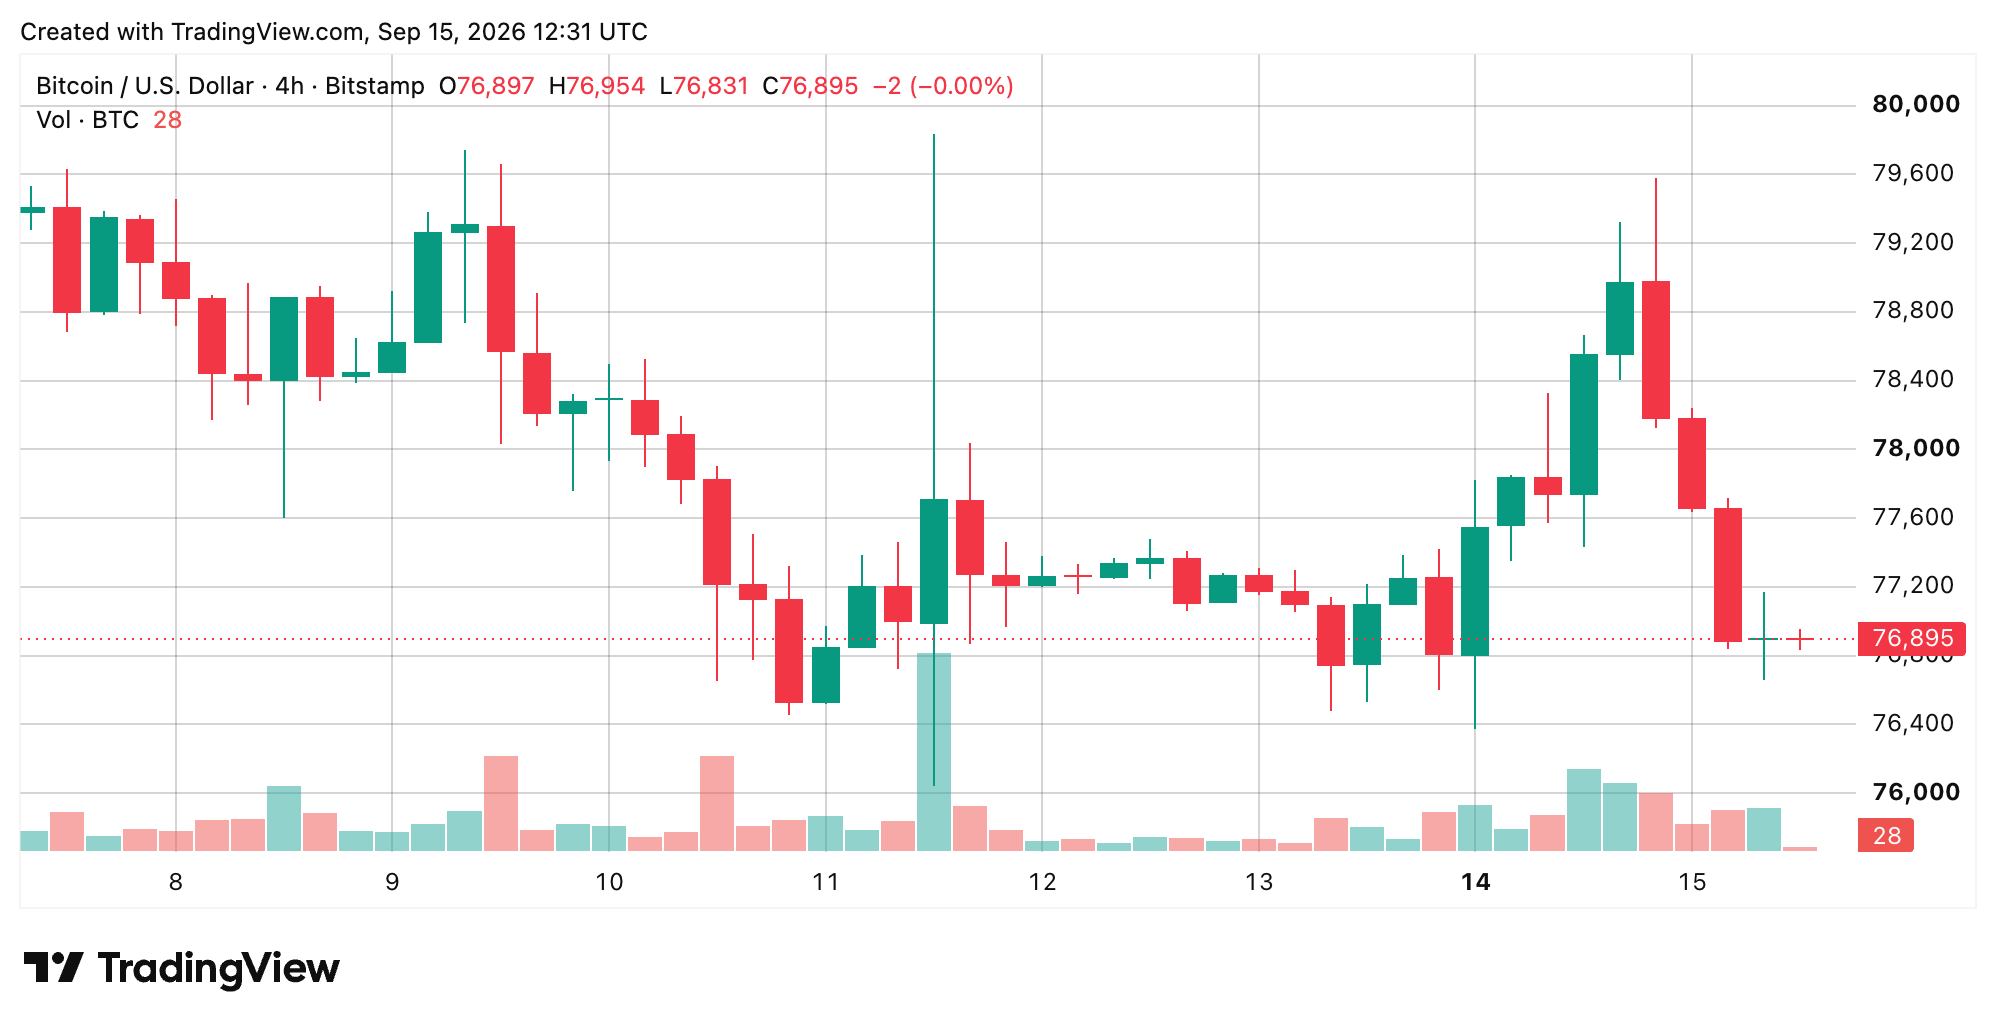
Support is concentrated around $76,000-$76,600, including the earlier $76,040 low, which makes this a technically important zone rather than just another round number on the chart. Holding it keeps a rebound in the cards, but confirmation would look cleaner if BTC reclaimed roughly $77,800-$78,000. From there, $78,500 and then $79,000-$79,600 become the next visible barriers. A sustained break below $76,000 would instead favor continuation of the existing short-term decline.
The Daily Chart Still Looks Considerably Better
The daily chart tells a less damaged story, which is where things get interesting. Bitcoin recovered from the June low around $57,735, eventually printing a recent swing high near $82,833 before pulling back into the mid-$76,000 area. The broader move from $62,470 to $82,281 cited in the chart analysis also leaves the current price comfortably inside the larger range rather than beneath it.
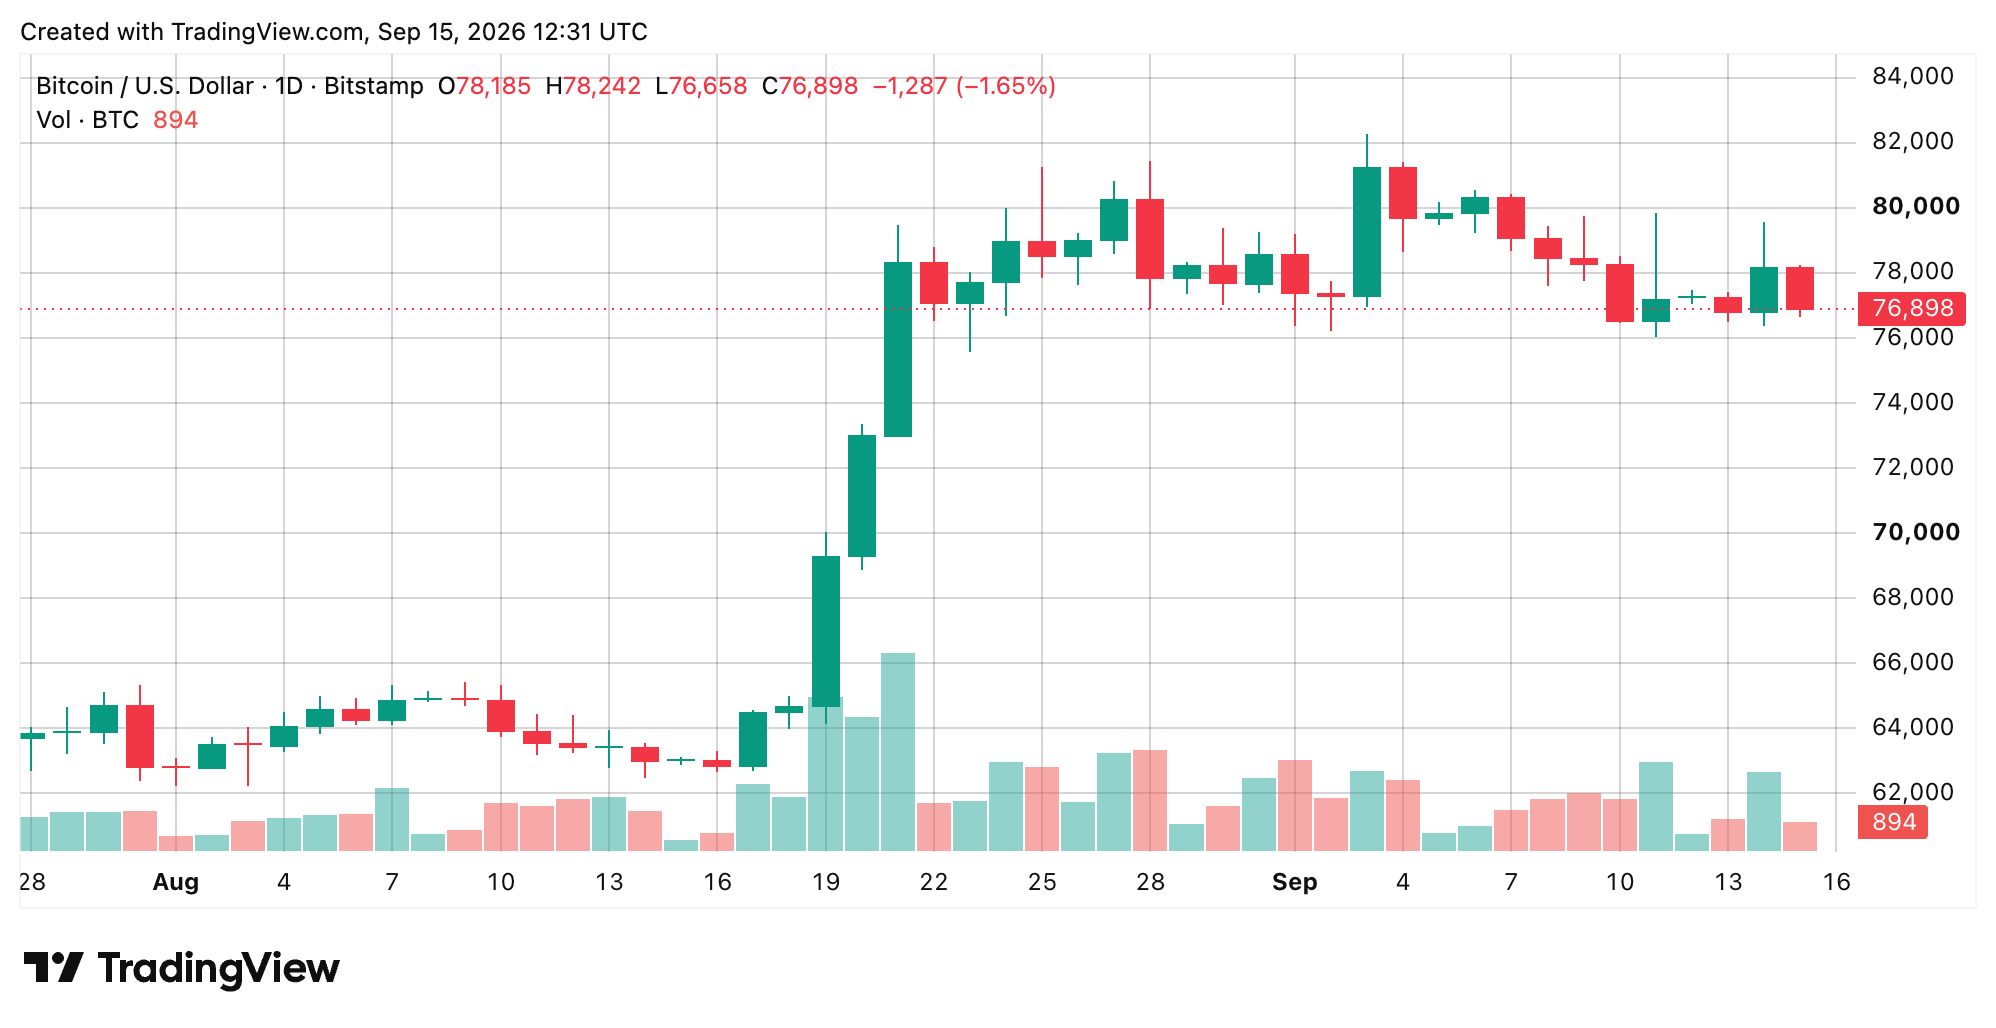
Daily support is concentrated around $76,000-$77,000, and holding that region keeps $78,000, $80,000, and eventually the $82,281 area in play. On the flip side, a convincing daily close below $76,000 would change the character of the consolidation and could open the door toward $74,000-$75,000, followed by the $72,000-$73,000 region. Recent daily volume has been mixed, with no extreme expansion during the latest decline.
Oscillators Are Mostly Neutral, but Two Are Flashing Negative
The oscillator board is far less dramatic than the intraday charts. The relative strength index (RSI) reads 53 and is neutral, while Stochastic sits at 20, also neutral. The commodity channel index (CCI) registers minus 85, the average directional index (ADX) is 43, and the awesome oscillator (AO) stands at 2,373, with all three rated neutral on Tuesday. Stochastic RSI fast is 9, Williams percent range is minus 87, and the ultimate oscillator (UO) is 39, again producing neutral, uneventful readings.
The negative pressure comes from momentum at minus 2,934 and the moving average convergence divergence (MACD) level at 1,321, both carrying bearish signals. Bull bear power, at minus 387, is the lone buy reading. Put together, market indicators count two bearish signals, eight neutral readings, and one bullish signal, leaving the oscillator summary semi-neutral rather than outright bearish.
Moving Averages Split Almost Perfectly Down the Middle
The daily chart’s moving averages (MAs) are where the market’s tug-of-war becomes almost comically tidy. The 10-period exponential moving average (EMA) at $77,660 and 10-period simple moving average (SMA) at $77,905 are both bearish, as are the 20-period EMA at $77,096 and 20-period SMA at $78,356. The 30-period EMA at $75,809 is a bullish signal, while the 30-period SMA at $76,942 is the opposite, showing a bearish reading. Farther out, the 50-period EMA at $73,508, 50-period SMA at $71,678, 100-period EMA at $71,289, 100-period SMA at $67,474, 200-period EMA at $73,070, and 200-period SMA at $70,247 are all bullish and positive readings.
The Ichimoku base line at $77,640 is neutral, while the volume-weighted moving average (VWMA) at $78,444 and Hull moving average (HMA) at $77,143 are in the red. The tally lands at seven bearish readings, one neutral, and seven bullish signals in total. In other words, bitcoin’s longer-term averages remain constructive while its shorter averages are still leaning against price. Right now, $76,000 is very much the line in the sand, and BTC has not yet shown that sellers are finished.
Bull Verdict
Bitcoin still has a path back into the driver’s seat if the $76,000-$76,700 support zone holds. A reclaim of $77,800-$78,000 would strengthen the rebound case, while $78,500 and then $79,000-$79,600 become the next upside tests. The daily structure remains healthier than the shorter time frames, and the 50-, 100- and 200-period moving averages continue to carry positive and bullish signals.
Bear Verdict
The bears still control the short-term tape while bitcoin remains below the $77,800-$78,000 recovery zone. The 1-hour and 4-hour charts continue to show lower highs and lower lows, while momentum and the moving average convergence divergence (MACD) remain on the bearish side. A sustained break below $76,000 would weaken the broader consolidation and could expose $74,000-$75,000, followed by the $72,000-$73,000 region.