FILE Price Prediction: The October Supply Bomb Is Loading — Will $0.90 Hold or Crack First?

James Ding
Sep 18, 2026 10:43
FILE is trading at $0.87 with an 8.65% intraday surge, but smart money is showing its hand with a 13% collapse in open interest — the real test arrives October 15, when a 75% supply cut hits and th…
The 8% Rip Hits a Wall — Here’s What’s Actually Happening
FILE printed a sharp 8.65% candle to $0.87 today and the crowd is cheering. Don’t get distracted by the daily number. Look under the hood and the picture is more complicated. Price is pressing into a cluster of moving averages that have acted as resistance all year, and the candle’s upper wick near the $0.88–$0.90 zone tells you sellers are already there to meet it. The immediate resistance at $0.90 and the strong ceiling at $0.93 (near the upper Bollinger Band at $0.94) represent the exact zone where FILE’s August–September rallies have repeatedly stalled.
What’s driving the price? The dominant narrative across crypto markets right now is FILE’s tokenomics event: on October 15, 2026, the six-year linear vesting schedule shared by Protocol Labs and the Filecoin Foundation comes to a complete end. That’s roughly 183,000 FIL per day in new supply — gone overnight. According to analysis published on Binance Square, this represents a 75% contraction in gross annual issuance, dropping total new supply from approximately 88 million tokens per year to around 22 million. Traders are front-running this event aggressively, and FILE’s 61.3% recovery from its August low of $0.61 is almost entirely a supply-shock bet.
For broader context on how the DePIN and decentralized storage narratives are intersecting with this event, Blockchain.news has been tracking the convergence of AI infrastructure demand and on-chain storage protocols throughout this cycle.
Moving Averages Say Breakout — Derivatives Say Be Careful
The technical structure has genuinely improved. FILE is trading above its SMA 7 ($0.86), SMA 20 ($0.81), SMA 50 ($0.75), and EMA 12 ($0.83) simultaneously — a clean bullish stack across all near-term timeframes. The %B at 0.73 means price is in the upper half of the Bollinger Band, and the pivot point at $0.85 is now acting as near-term support rather than resistance. These are legitimately constructive signals.
But the momentum oscillators are sending a conflicting message. The MACD histogram has flatlined at zero — a MACD line and signal that have converged means the trend thrust that powered the rally is currently exhausted, not accelerating. The RSI at 57.5 is mid-range, which sounds neutral until you realize FILE peaked at RSI 73–74 just three days ago (per Coinpedia’s September 15 data showing the overbought reading before a sharp $0.11 intraday correction). The Stochastic %K at 39.68 crossing above %D at 31.75 is a micro-bullish signal from oversold territory, but this is a 1-day chart — it tells you a bounce is possible, not that a trend has resumed.
The critical levels to watch are tight and binary: hold $0.81 (SMA 20 and immediate support) and FILE has a legitimate shot at $0.90 and beyond. Lose $0.81 and the next meaningful floor is $0.76 (strong support), with the SMA 50 at $0.75 providing the last line before the August lows come back into view.
Smart Money Is Leaning Long, But the Tape Is Selling Into It
Here’s where it gets interesting. Top traders (the so-called smart money tracked via Binance’s top trader long/short ratio) are holding a heavily bullish 1.85:1 long-to-short ratio — 64.9% long. Retail mirrors that at 1.43:1. On paper, both camps are aligned in the same direction. That’s actually a yellow flag in derivatives markets, not a green one. When everyone is positioned the same way, the pain trade moves opposite.
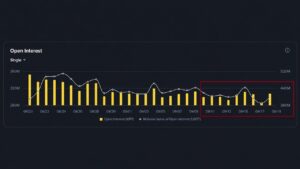
More telling is the taker buy/sell ratio sitting at 0.89 — sell volume is outpacing buy volume in real-time aggressive order flow. The market is being sold on this intraday pump, not accumulated. Combined with the 13% collapse in open interest over 24 hours, what you’re seeing is leveraged long positions being closed or liquidated after the recent spike from the $0.61 low. This is profit-taking dressed up as a rally continuation.
Hourly candlesticks (about 96 bars), same endpoint as our cryptocurrency price pages. Numbers below refresh from 1-minute klines.
More FILE news, FILE price prediction and analysis
Viktoras Karapetjanc, analyst at Traders Union, acknowledged the setup back on September 13, stating: “With anticipated supply reduction and technical confirmation, I expect continued upside in FIL as long as current supports hold.” That qualifier — “as long as current supports hold” — is doing a lot of work right now. The $0.81–$0.85 zone is the entire thesis. Blockchain.news readers following the DePIN storage sector will note this is the same tension playing out across IO.net and Render, where supply-reduction narratives are running ahead of actual demand confirmation.
Bull vs. Bear Paths to November — Pick Your Side
The bull case is clean and specific: FILE holds $0.81 through next week, open interest stabilizes and begins building again, and the October 15 vesting cutoff serves as a hard catalyst. In this scenario, any renewed bid from Bitcoin correlation (BTC has been broadly supportive for altcoins in Q3 2026) propels FILE through $0.90 resistance and into the $0.93–$1.05 zone over the next 7–14 days. The 30-day target in this path is $1.05–$1.10, a level consistent with pre-vesting euphoria and the prior cycle high of $1.037 seen on September 15. Invalidation for bulls: a daily close below $0.81.
The bear case is less flashy but statistically credible. FILE has already rallied 61% from its lows in five weeks. The MACD has spent all of its momentum. Open interest is declining even as price holds up — a classic divergence that precedes mean reversion. A flush back to $0.76–$0.78 before the October event is entirely realistic, particularly if broader altcoin sentiment deteriorates (the Altcoin Season Index was reported at 36 as recently as September 15 by Coinpedia). The bear target sits at $0.76 on a $0.81 breach, with $0.68 (lower Bollinger Band) the worst-case 30-day scenario if macro sentiment turns sharply negative. Invalidation for bears: a convincing daily close above $0.93 on expanding volume.
The honest probabilistic read: 55% chance FILE chops between $0.81 and $0.93 for the next two weeks as the market digests the rally and positions for October 15. A 30% probability of a breakout above $0.93 if Bitcoin sustains above key levels. A 15% probability of a capitulation below $0.81 back toward $0.76 if taker sell pressure accelerates. The October 15 vesting end is a real, dated, supply-side event — but the market has already started pricing it in. The question is whether the demand side of that equation, namely paid storage adoption and AI infrastructure usage, actually shows up to validate the thesis. As of today, that remains an open question, and FILE is being priced largely on the hope that it does.
Image source: Shutterstock