TRB Price Prediction: Oracle Token Eyes $27 Breakout Despite Derivative Headwinds

Rongchai Wang
Apr 17, 2026 15:58
TRB’s explosive 8.32% surge above all major moving averages signals a potential run to $27.77, but massive open interest liquidations and aggressive selling pressure create a 35% probability of rej…
Market Context: Why TRB is Moving Now
Tellor’s oracle infrastructure is catching fire as the token breaks decisively above its 200-day moving average at $20.24 for the first time in months. The 8.32% daily surge isn’t just noise – it’s institutional accumulation finally overwhelming retail panic. With price sitting at $19.92 and trading near the upper Bollinger Band, TRB has shifted from oversold recovery to genuine momentum play.
The oracle narrative is heating up as DeFi protocols demand more reliable price feeds, and TRB’s decentralized approach is gaining traction over centralized competitors. CMC AI’s recent analysis highlighting “technical upgrades and competitive adoption” as key drivers aligns perfectly with this breakout timing.
Indicator Alignment
The technicals are screaming bullish despite some concerning undertones. TRB’s RSI at 62.18 sits comfortably in the momentum zone without reaching overbought territory, leaving substantial room for expansion. The MACD at 0.9249 with a flat histogram signals consolidation at elevated levels – typically a precursor to the next leg higher.
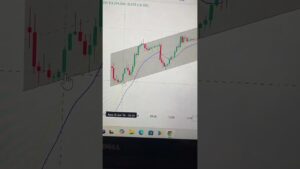
Hourly candlesticks (about 96 bars), same endpoint as our cryptocurrency price pages. Numbers below refresh from 1-minute klines.
Full TRB price, calculator & analysis
Most telling is the Bollinger Band position at 0.99, meaning TRB is pressing against the upper boundary at $20.01. When volatile assets like TRB test these levels with this kind of volume ($18.7M), they either explode higher or face violent rejection. The 7-day SMA crossing above longer averages confirms the trend shift is real.
Whales & Analyst Targets
Smart money positioning reveals a complex picture. Top traders maintain a bullish 2.56 long/short ratio with 71.9% positioned for upside – these aren’t retail FOMO buyers but sophisticated players expecting continuation. However, the taker buy/sell ratio of 0.88 shows aggressive selling pressure is building as weak hands exit into strength.
The derivatives market tells a darker story. Open interest crashed 51% in 24 hours to $5.7M, indicating massive position liquidations and profit-taking. The 0.005% funding rate remains neutral, but this could shift rapidly if momentum accelerates.
Strategic Positioning
Bull Case (65% probability): TRB breaks $24.28 intraday high on volume, triggering algorithmic buying toward the $27.77 resistance level. Oracle demand continues expanding, and technical breakout attracts momentum funds. Target: $27-30 within 7-14 days.
Bear Case (35% probability): Rejection at current levels leads to gap-fill back to $17.15 support as profit-taking overwhelms buying interest. Derivative liquidations cascade into spot selling. Target: $14-17 within 3-7 days.
The key trigger level is $24. Above this price, stop-losses flip to stop-buys and the rally accelerates. Below $18.50, the breakout narrative dies and TRB reverts to range-bound grinding. With funding neutral and volatility expanding, the next 48 hours will determine whether this oracle play has real legs or becomes another failed breakout in the crypto graveyard.
Position accordingly – this isn’t a hold-and-hope trade.
Image source: Shutterstock